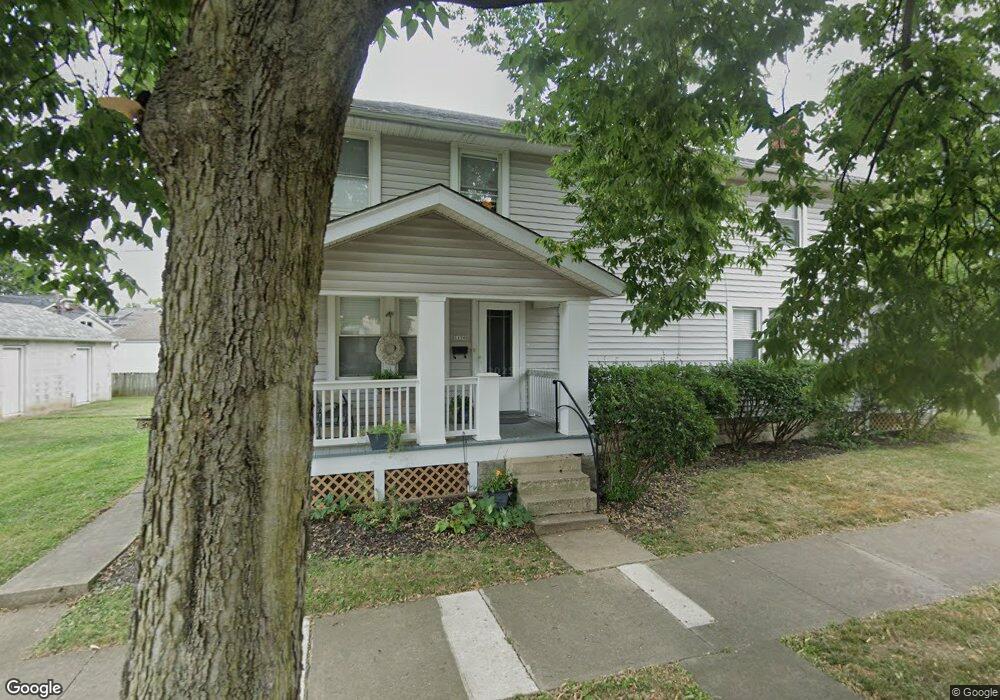
1170 Mulford Rd Unit 176 Columbus, OH 43212
Estimated Value: $469,000 - $669,200
6
Beds
2
Baths
2,504
Sq Ft
$222/Sq Ft
Est. Value
About This Home
This home is located at 1170 Mulford Rd Unit 176, Columbus, OH 43212 and is currently estimated at $555,050, approximately $221 per square foot. 1170 Mulford Rd Unit 176 is a home located in Franklin County with nearby schools including Robert Louis Stevenson Elementary School, Larson Middle School, and Grandview Heights High School.
Ownership History
Date
Name
Owned For
Owner Type
Purchase Details
Closed on
Oct 3, 2018
Sold by
Mohr Ronald E and Mohr Sophia B
Bought by
Sbj One Properties Llc
Current Estimated Value
Home Financials for this Owner
Home Financials are based on the most recent Mortgage that was taken out on this home.
Interest Rate
4.72%
Purchase Details
Closed on
Jun 26, 2001
Sold by
Myers Thomas L and Myers Carol A
Bought by
Mohr Ronald E and Mohr Sophia B
Home Financials for this Owner
Home Financials are based on the most recent Mortgage that was taken out on this home.
Original Mortgage
$157,500
Interest Rate
7.2%
Purchase Details
Closed on
May 2, 1983
Bought by
Myers Thomas L and Myers Carol A
Create a Home Valuation Report for This Property
The Home Valuation Report is an in-depth analysis detailing your home's value as well as a comparison with similar homes in the area
Home Values in the Area
Average Home Value in this Area
Purchase History
| Date | Buyer | Sale Price | Title Company |
|---|---|---|---|
| Sbj One Properties Llc | -- | -- | |
| Mohr Ronald E | $175,000 | -- | |
| Myers Thomas L | -- | -- |
Source: Public Records
Mortgage History
| Date | Status | Borrower | Loan Amount |
|---|---|---|---|
| Closed | Sbj One Properties Llc | -- | |
| Previous Owner | Mohr Ronald E | $157,500 |
Source: Public Records
Tax History Compared to Growth
Tax History
| Year | Tax Paid | Tax Assessment Tax Assessment Total Assessment is a certain percentage of the fair market value that is determined by local assessors to be the total taxable value of land and additions on the property. | Land | Improvement |
|---|---|---|---|---|
| 2024 | $9,390 | $158,070 | $63,040 | $95,030 |
| 2023 | $8,246 | $158,060 | $63,035 | $95,025 |
| 2022 | $8,611 | $140,560 | $49,070 | $91,490 |
| 2021 | $8,073 | $140,560 | $49,070 | $91,490 |
| 2020 | $8,041 | $140,560 | $49,070 | $91,490 |
| 2019 | $7,723 | $119,460 | $49,070 | $70,390 |
| 2018 | $6,866 | $119,460 | $49,070 | $70,390 |
| 2017 | $6,627 | $119,460 | $49,070 | $70,390 |
| 2016 | $6,034 | $85,410 | $29,370 | $56,040 |
| 2015 | $6,035 | $85,410 | $29,370 | $56,040 |
| 2014 | $6,053 | $85,410 | $29,370 | $56,040 |
| 2013 | $2,665 | $77,630 | $26,705 | $50,925 |
Source: Public Records
Map
Nearby Homes
- 932 Mcclain Rd
- 1129 Mulford Rd
- 1081 W 3rd Ave
- 1081 Northwest Blvd Unit 2
- 1111 Northwest Blvd Unit 113
- 1225 Eastview Ave
- 922 Northwest Blvd
- 910-912 Northwest Blvd
- 1240 Oxley Rd
- 1242 Oxley Rd
- 1083 W 3rd Ave
- 1095 W 3rd Ave
- 1093 W 3rd Ave
- 1297 Doten Ave
- 1475 W 3rd Ave Unit 204
- 1000 Urlin Ave Unit 2007
- 1000 Urlin Ave Unit 520
- 1000 Urlin Ave Unit 605
- 1000 Urlin Ave Unit 511
- 1000 Urlin Ave Unit 1007
- 1166 Mulford Rd Unit 168
- 1177 Mulford Rd
- 1162 Mulford Rd Unit 164
- 1012 Palmer Rd
- 1169 Mulford Rd
- 1008 Palmer Rd
- 1016 Palmer Rd
- 1167 Mulford Rd Unit 169
- 1167-1169 Mulford Rd
- 971 Mcclain Rd
- 1018 Palmer Rd
- 1150 Mulford Rd Unit 154
- 1154 Mulford Rd Unit 4
- 996 Palmer Rd
- 1149 Mulford Rd Unit 153
- 1022 Palmer Rd
- 968 Mcclain Rd
- 967 Mcclain Rd
- 1146-1148 Mulford Rd
- 1032 Palmer Rd