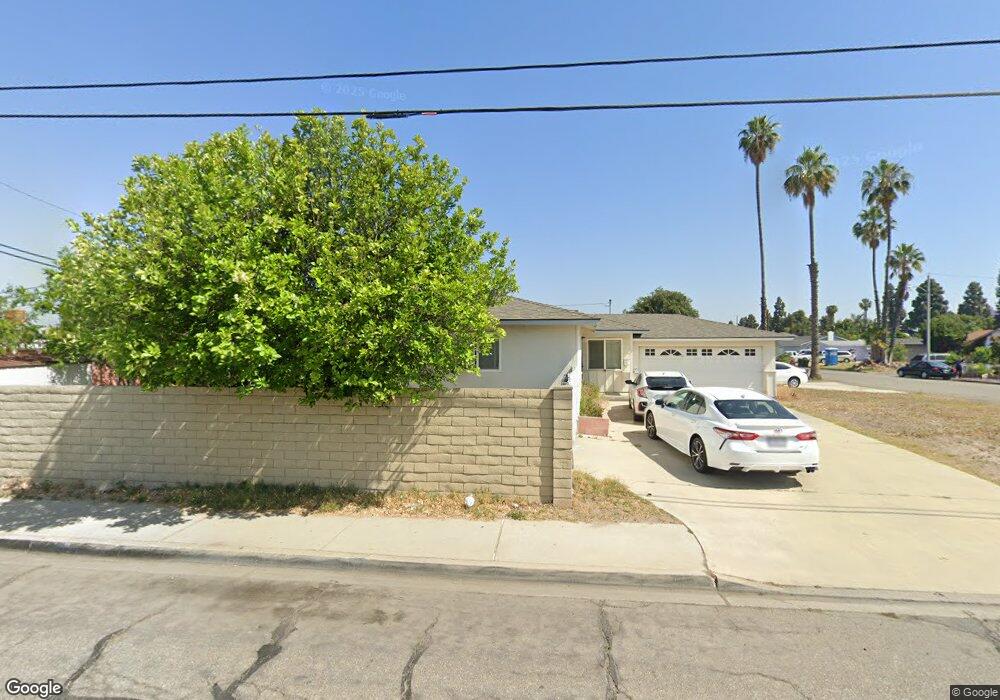
11701 Stephanie Ln Garden Grove, CA 92840
Estimated Value: $1,001,000 - $1,115,000
3
Beds
2
Baths
1,718
Sq Ft
$608/Sq Ft
Est. Value
About This Home
This home is located at 11701 Stephanie Ln, Garden Grove, CA 92840 and is currently estimated at $1,044,931, approximately $608 per square foot. 11701 Stephanie Ln is a home located in Orange County with nearby schools including Faylane Elementary School, Lake Intermediate School, and Rancho Alamitos High School.
Ownership History
Date
Name
Owned For
Owner Type
Purchase Details
Closed on
Nov 3, 2020
Sold by
Dang Dzung Tri & Nhan Kim Tran and Dang Nhan Kim
Bought by
2020 Dzung & Nhan Dang Family Trust and Dang
Current Estimated Value
Purchase Details
Closed on
Sep 17, 1996
Sold by
Federal Home Loan Mortgage Corporation
Bought by
Dang Dzung Tri and Tran Nhan Kim
Home Financials for this Owner
Home Financials are based on the most recent Mortgage that was taken out on this home.
Original Mortgage
$114,100
Interest Rate
7.88%
Purchase Details
Closed on
Feb 29, 1996
Sold by
Squier Michael R and Squier Eileen B
Bought by
Federal Home Loan Mortgage Corporation
Purchase Details
Closed on
Jun 19, 1995
Sold by
Squier Michael R and Squier Eileen B
Bought by
Federal Home Loan Mortgage Corporation
Purchase Details
Closed on
Jun 9, 1995
Sold by
Squier Michael R and Squier Eileen B
Bought by
Professional Foreclosure Service
Create a Home Valuation Report for This Property
The Home Valuation Report is an in-depth analysis detailing your home's value as well as a comparison with similar homes in the area
Home Values in the Area
Average Home Value in this Area
Purchase History
| Date | Buyer | Sale Price | Title Company |
|---|---|---|---|
| 2020 Dzung & Nhan Dang Family Trust | -- | None Listed On Document | |
| Dang Dzung Tri | -- | None Available | |
| Dang Dzung Tri | $163,000 | Old Republic Title Company | |
| Federal Home Loan Mortgage Corporation | $147,087 | -- | |
| Federal Home Loan Mortgage Corporation | $136,026 | -- | |
| Professional Foreclosure Service | -- | -- |
Source: Public Records
Mortgage History
| Date | Status | Borrower | Loan Amount |
|---|---|---|---|
| Previous Owner | Dang Dzung Tri | $114,100 |
Source: Public Records
Tax History Compared to Growth
Tax History
| Year | Tax Paid | Tax Assessment Tax Assessment Total Assessment is a certain percentage of the fair market value that is determined by local assessors to be the total taxable value of land and additions on the property. | Land | Improvement |
|---|---|---|---|---|
| 2025 | $3,468 | $265,467 | $179,682 | $85,785 |
| 2024 | $3,468 | $260,262 | $176,159 | $84,103 |
| 2023 | $3,401 | $255,159 | $172,705 | $82,454 |
| 2022 | $3,348 | $250,156 | $169,318 | $80,838 |
| 2021 | $3,315 | $245,251 | $165,998 | $79,253 |
| 2020 | $3,278 | $242,737 | $164,296 | $78,441 |
| 2019 | $3,202 | $237,978 | $161,075 | $76,903 |
| 2018 | $3,151 | $233,312 | $157,916 | $75,396 |
| 2017 | $3,108 | $228,738 | $154,820 | $73,918 |
| 2016 | $2,961 | $224,253 | $151,784 | $72,469 |
| 2015 | $2,924 | $220,885 | $149,504 | $71,381 |
| 2014 | $2,827 | $216,559 | $146,576 | $69,983 |
Source: Public Records
Map
Nearby Homes
- 11762 Gary St
- 10221 Roselee Dr
- 10072 Roselee Dr
- 11441 Dolan St
- 11912 Brookhaven St Unit 65
- 10691 Perrin Dr
- 12071 Diane St
- 9901 Royal Palm Blvd
- 11301 Euclid St Unit 109
- 11301 Euclid St Unit 60
- 12262 Morrie Ln
- 12266 Madras Place
- 10111 Dewey Dr
- 10622 Tibbs Cir
- 10112 Becca Dr
- 9751 Oma Place
- 12256 Lesley St
- 9881 Aldgate Ave
- 11421 Barclay Dr
- 10442 Lampson Ave
- 11691 Stephanie Ln
- 11702 Faye Ave
- 11692 Faye Ave
- 11671 Stephanie Ln
- 10432 Patricia Dr
- 10422 Patricia Dr
- 10442 Patricia Dr
- 11702 Stephanie Ln
- 11672 Faye Ave
- 11692 Stephanie Ln
- 10412 Patricia Dr
- 10462 Patricia Dr
- 11661 Stephanie Ln
- 11672 Stephanie Ln
- 11662 Faye Ave
- 10392 Patricia Dr
- 10472 Patricia Dr
- 11662 Stephanie Ln
- 10441 Doris Ave
- 10461 Doris Ave