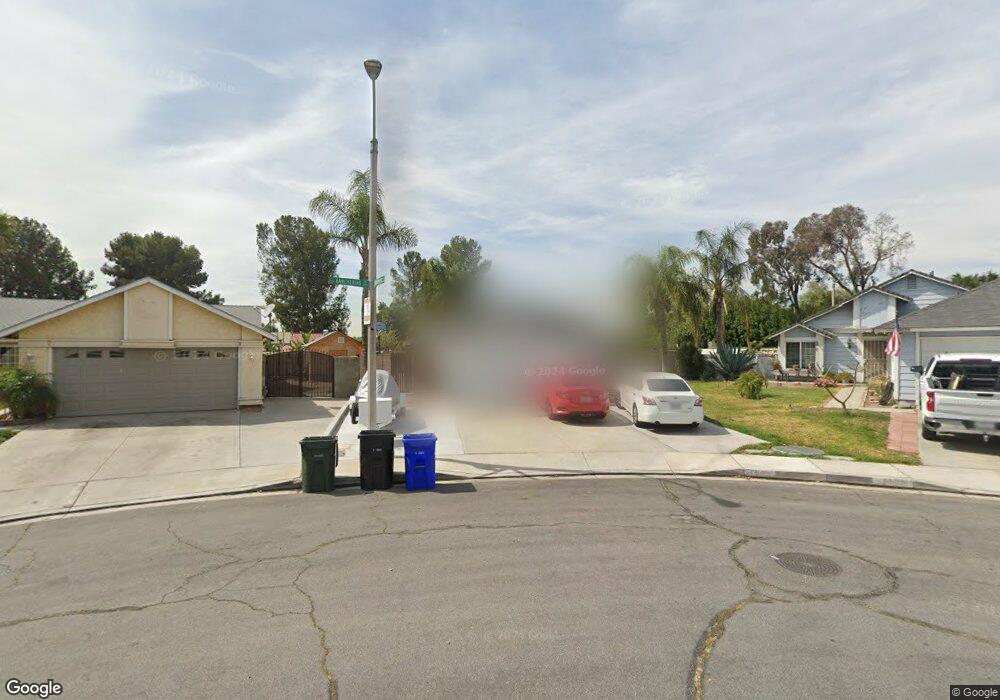
11702 Rancherias Dr Fontana, CA 92337
Southridge Village NeighborhoodEstimated Value: $503,000 - $595,000
3
Beds
2
Baths
958
Sq Ft
$577/Sq Ft
Est. Value
About This Home
This home is located at 11702 Rancherias Dr, Fontana, CA 92337 and is currently estimated at $552,299, approximately $576 per square foot. 11702 Rancherias Dr is a home located in San Bernardino County with nearby schools including Oak Park Elementary School, Southridge Middle School, and Henry J. Kaiser High School.
Ownership History
Date
Name
Owned For
Owner Type
Purchase Details
Closed on
Jun 2, 1998
Sold by
Bankers Trust Company Of California Na
Bought by
Lopez John and Lopez Patricia
Current Estimated Value
Home Financials for this Owner
Home Financials are based on the most recent Mortgage that was taken out on this home.
Original Mortgage
$79,908
Interest Rate
6.9%
Mortgage Type
FHA
Purchase Details
Closed on
Dec 4, 1997
Sold by
Cummings John
Bought by
Vendee Mtg Trust 1995-1
Purchase Details
Closed on
Oct 12, 1994
Sold by
Va
Bought by
Cummings John
Home Financials for this Owner
Home Financials are based on the most recent Mortgage that was taken out on this home.
Original Mortgage
$92,000
Interest Rate
8.54%
Mortgage Type
Seller Take Back
Purchase Details
Closed on
Oct 18, 1993
Sold by
Professional Foreclosure Corp
Bought by
Cenlar Fsb
Purchase Details
Closed on
Jul 20, 1993
Sold by
Cenlar Fsb
Bought by
Va
Create a Home Valuation Report for This Property
The Home Valuation Report is an in-depth analysis detailing your home's value as well as a comparison with similar homes in the area
Home Values in the Area
Average Home Value in this Area
Purchase History
| Date | Buyer | Sale Price | Title Company |
|---|---|---|---|
| Lopez John | $80,000 | First American Title Ins Co | |
| Vendee Mtg Trust 1995-1 | $60,000 | Landsafe Title | |
| Cummings John | $92,000 | Gateway Title Company | |
| Cenlar Fsb | $92,211 | Union Land Title Company | |
| Va | -- | Union Land Title Company |
Source: Public Records
Mortgage History
| Date | Status | Borrower | Loan Amount |
|---|---|---|---|
| Previous Owner | Lopez John | $79,908 | |
| Previous Owner | Cummings John | $92,000 |
Source: Public Records
Tax History Compared to Growth
Tax History
| Year | Tax Paid | Tax Assessment Tax Assessment Total Assessment is a certain percentage of the fair market value that is determined by local assessors to be the total taxable value of land and additions on the property. | Land | Improvement |
|---|---|---|---|---|
| 2025 | $2,979 | $125,261 | $31,353 | $93,908 |
| 2024 | $2,979 | $122,805 | $30,738 | $92,067 |
| 2023 | $2,464 | $120,397 | $30,135 | $90,262 |
| 2022 | $2,425 | $118,036 | $29,544 | $88,492 |
| 2021 | $2,387 | $115,722 | $28,965 | $86,757 |
| 2020 | $2,369 | $114,535 | $28,668 | $85,867 |
| 2019 | $2,331 | $112,289 | $28,106 | $84,183 |
| 2018 | $2,331 | $110,087 | $27,555 | $82,532 |
| 2017 | $2,298 | $107,929 | $27,015 | $80,914 |
| 2016 | $2,252 | $105,812 | $26,485 | $79,327 |
| 2015 | $2,217 | $104,222 | $26,087 | $78,135 |
| 2014 | $2,205 | $102,180 | $25,576 | $76,604 |
Source: Public Records
Map
Nearby Homes
- 13995 Ranchero Dr
- 14018 Ridgewood Dr
- 11557 Oakwood Dr
- 14045 Parkwood Dr
- 14213 Ranchero Dr
- 12045 Glenheather Dr
- 11919 Woodbridge Dr
- 14241 Elizabeth Ct
- 14421 El Contento Ave
- 3050 Cabana St
- 11840 Rustic Place
- 11820 Rustic Place
- 3087 Cabana St
- 11431 Winery Dr
- 13981 Rose Ave
- 14515 Woodland Dr Unit 10
- 14601 Long View Dr
- 11394 Aqua Ct
- Plan 2320 at Parkview - Canopy at Parkview
- Plan 2056 at Parkview - Canopy at Parkview
- 13938 Ranchero Dr
- 11712 Rancherias Dr
- 11701 Calabash Ave
- 13946 Ranchero Dr
- 11715 Calabash Ave
- 11720 Rancherias Dr
- 11727 Calabash Ave
- 13954 Ranchero Dr
- 13947 Ranchero Dr
- 11728 Rancherias Dr
- 13921 Monterra Ave
- 13955 Ranchero Dr
- 13962 Ranchero Dr
- 13927 Monterra Ave
- 11738 Rancherias Dr
- 11741 Calabash Ave
- 13948 Ridgewood Dr
- 13939 Monterra Ave
- 13963 Ranchero Dr
- 11678 Rancherias Dr