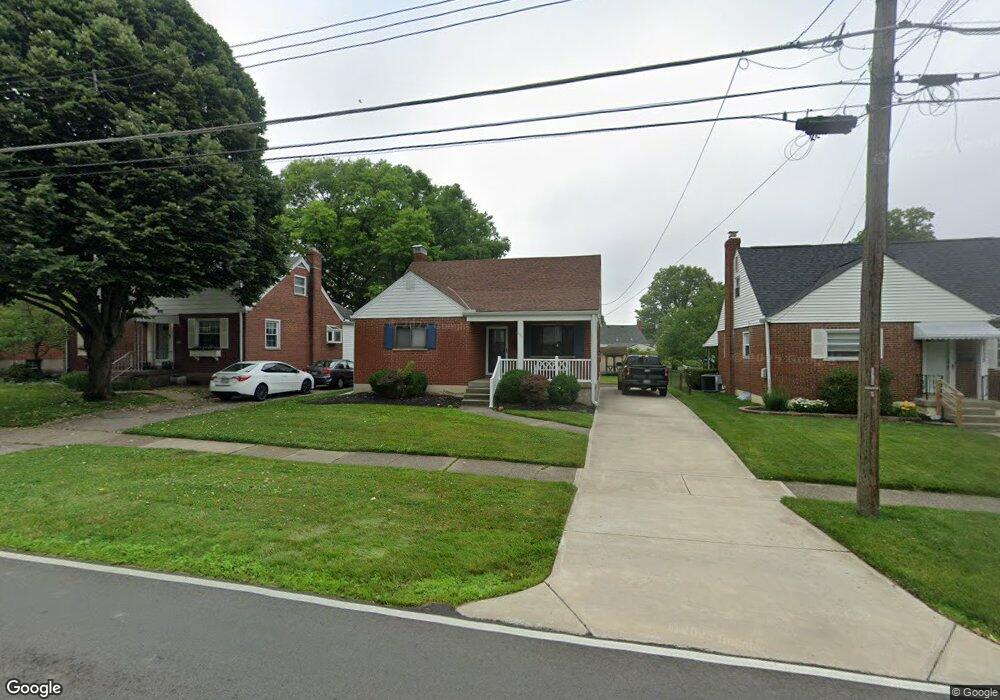
1171 Fuhrman Rd Cincinnati, OH 45215
Estimated Value: $242,000 - $269,000
3
Beds
2
Baths
1,405
Sq Ft
$182/Sq Ft
Est. Value
About This Home
This home is located at 1171 Fuhrman Rd, Cincinnati, OH 45215 and is currently estimated at $255,598, approximately $181 per square foot. 1171 Fuhrman Rd is a home located in Hamilton County with nearby schools including Reading Community High School, Saints Peter and Paul Academy, and Linden Grove School.
Ownership History
Date
Name
Owned For
Owner Type
Purchase Details
Closed on
Aug 24, 1998
Sold by
Mcfarland Foster Christopher L & Bethany K and Foster Bethany K
Bought by
Foster Christopher L and Foster Bethany K
Current Estimated Value
Home Financials for this Owner
Home Financials are based on the most recent Mortgage that was taken out on this home.
Original Mortgage
$74,000
Outstanding Balance
$15,223
Interest Rate
6.76%
Estimated Equity
$240,375
Purchase Details
Closed on
May 23, 1997
Sold by
Bisping Jack F and Bisping Julie Ann
Bought by
Foster Christopher L and Mcfarland Bethany K
Home Financials for this Owner
Home Financials are based on the most recent Mortgage that was taken out on this home.
Original Mortgage
$75,500
Interest Rate
8.17%
Purchase Details
Closed on
May 17, 1995
Sold by
Metzger Mark and Metzger Holly
Bought by
Bisping Ii Jack F and Bisping Julie Ann
Home Financials for this Owner
Home Financials are based on the most recent Mortgage that was taken out on this home.
Original Mortgage
$86,450
Interest Rate
8.42%
Create a Home Valuation Report for This Property
The Home Valuation Report is an in-depth analysis detailing your home's value as well as a comparison with similar homes in the area
Home Values in the Area
Average Home Value in this Area
Purchase History
| Date | Buyer | Sale Price | Title Company |
|---|---|---|---|
| Foster Christopher L | -- | -- | |
| Foster Christopher L | $96,500 | -- | |
| Bisping Ii Jack F | -- | -- |
Source: Public Records
Mortgage History
| Date | Status | Borrower | Loan Amount |
|---|---|---|---|
| Open | Foster Christopher L | $74,000 | |
| Closed | Foster Christopher L | $75,500 | |
| Previous Owner | Bisping Ii Jack F | $86,450 |
Source: Public Records
Tax History Compared to Growth
Tax History
| Year | Tax Paid | Tax Assessment Tax Assessment Total Assessment is a certain percentage of the fair market value that is determined by local assessors to be the total taxable value of land and additions on the property. | Land | Improvement |
|---|---|---|---|---|
| 2024 | $3,561 | $65,580 | $12,338 | $53,242 |
| 2023 | $3,555 | $65,580 | $12,338 | $53,242 |
| 2022 | $3,053 | $43,747 | $10,689 | $33,058 |
| 2021 | $2,612 | $43,747 | $10,689 | $33,058 |
| 2020 | $2,576 | $43,747 | $10,689 | $33,058 |
| 2019 | $2,509 | $38,714 | $9,461 | $29,253 |
| 2018 | $2,510 | $38,714 | $9,461 | $29,253 |
| 2017 | $2,398 | $38,714 | $9,461 | $29,253 |
| 2016 | $2,437 | $39,033 | $9,272 | $29,761 |
| 2015 | $2,425 | $39,033 | $9,272 | $29,761 |
| 2014 | $2,131 | $39,033 | $9,272 | $29,761 |
| 2013 | $2,160 | $39,831 | $9,461 | $30,370 |
Source: Public Records
Map
Nearby Homes
- 1194 Fuhrman Rd
- 1246 Thurnridge Dr
- 796 Kenray Ct
- 2127 Longmeadow Ln
- 1626 Krylon Dr
- 2451 Hunt Rd
- 636 Maple Dr
- 2413 Carol Dr
- L Apple Ridge Ln
- 234 Mcguire Ln
- 2598 Maple Tree Ct
- 2590 Hunt Rd
- 1684 Sanborn Dr
- 69 Orchard Knoll Dr
- 2558 Apple Ridge Ln
- 2626 Hunt Rd
- 113 Waxwing Dr
- 2920 E Galbraith Rd
- 310 E Vine St
- 0 Hill St Unit 1616370
- 1175 Fuhrman Rd
- 1167 Fuhrman Rd
- 1179 Fuhrman Rd
- 1163 Fuhrman Rd
- 1200 Fuhrman Rd
- 1170 Georgia Ln
- 0 Fuhrman Rd
- 0 Fuhrman Rd
- 1166 Georgia Ln
- 1183 Fuhrman Rd
- 1174 Georgia Ln
- 1159 Fuhrman Rd
- 1178 Georgia Ln
- 1162 Georgia Ln
- 1164 Fuhrman Rd
- 1187 Fuhrman Rd
- 1168 Fuhrman Rd
- 1160 Fuhrman Rd
- 1182 Georgia Ln
- 1155 Fuhrman Rd