
Seller's Agent in 2012
Sandy Morris
Ferrari-Lund Real Estate Reno
(775) 742-5604
1 in this area
35 Total Sales


Estimated Value: $412,000 - $432,000
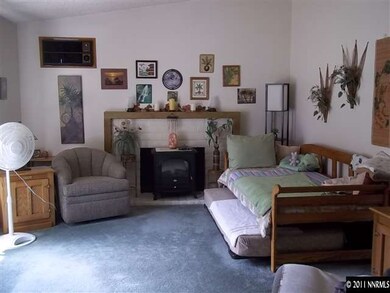
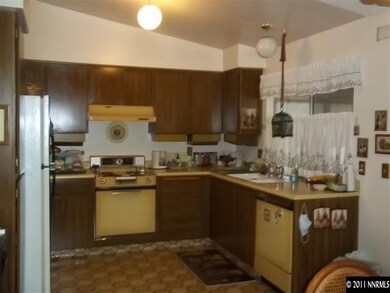
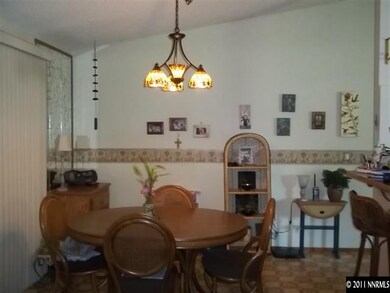
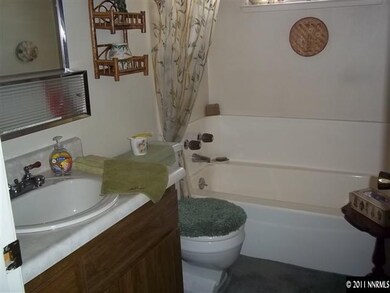
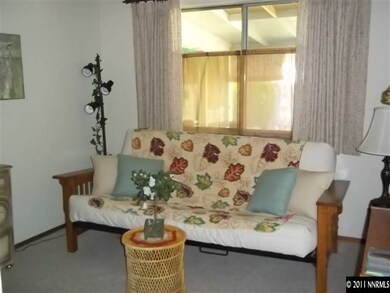
1171 La Via - Quiet Sparks neighborhood on a corner lot. Perfect condition inside and out. Everything works. Gorgeous back yard with lots mature landscape. Inside very clean and well maintained. Appliances stay. Light neutral colors. New garage door opener. Bath tub in guest bath and shower stall in master bathroom. Hurry. This one won't last long., Owner must be present for showings as she has two small dogs that need to be watched. Please give notice if possible but call the office or listing agent any time. Owner is home most of the time.
Last Agent to Sell the Property
Ferrari-Lund Real Estate Reno License #S.18864 Listed on: 08/04/2011
Last Buyer's Agent
Robin Beesemyer
HomeGate Realty of Nevada License #S.167566
| Date | Buyer | Sale Price | Title Company |
|---|---|---|---|
| Carolyn Stuart Trust | -- | None Listed On Document | |
| Stuart Carolyn J | $106,000 | First Centennial Reno | |
| Armstrong Betty J | -- | Western Title Incorporated | |
| Kuchler Carolyn | -- | Western Title Incorporated |
| Date | Status | Borrower | Loan Amount |
|---|---|---|---|
| Previous Owner | Stuart Carolyn J | $103,312 | |
| Previous Owner | Armstrong Betty J | $259,500 | |
| Closed | Armstrong Betty J | $259,500 |
| Date | Event | Price | List to Sale | Price per Sq Ft |
|---|---|---|---|---|
| 02/24/2012 02/24/12 | Sold | $106,000 | -6.1% | $87 / Sq Ft |
| 11/18/2011 11/18/11 | Pending | -- | -- | -- |
| 08/04/2011 08/04/11 | For Sale | $112,900 | -- | $93 / Sq Ft |
| Year | Tax Paid | Tax Assessment Tax Assessment Total Assessment is a certain percentage of the fair market value that is determined by local assessors to be the total taxable value of land and additions on the property. | Land | Improvement |
|---|---|---|---|---|
| 2025 | $1,269 | $57,768 | $37,275 | $20,493 |
| 2024 | $1,269 | $52,830 | $32,620 | $20,210 |
| 2023 | $892 | $50,414 | $31,710 | $18,704 |
| 2022 | $1,198 | $43,616 | $27,475 | $16,141 |
| 2021 | $1,164 | $37,797 | $21,175 | $16,622 |
| 2020 | $1,128 | $37,697 | $20,510 | $17,187 |
| 2019 | $1,095 | $36,183 | $18,865 | $17,318 |
| 2018 | $1,064 | $30,837 | $13,405 | $17,432 |
| 2017 | $1,034 | $31,337 | $12,810 | $18,527 |
| 2016 | $1,007 | $31,659 | $12,355 | $19,304 |
| 2015 | $1,006 | $29,645 | $9,695 | $19,950 |
| 2014 | $976 | $28,148 | $8,435 | $19,713 |
| 2013 | -- | $26,018 | $6,055 | $19,963 |
Seller's Agent in 2012
Sandy Morris
Ferrari-Lund Real Estate Reno
(775) 742-5604
1 in this area
35 Total Sales
R
Buyer's Agent in 2012
Robin Beesemyer
HomeGate Realty of Nevada
Source: Northern Nevada Regional MLS
MLS Number: 110010913
APN: 036-193-04
Disclaimer: Certain information contained herein is derived from information provided by parties other than Homes.com. All information provided is deemed reliable, but is not guaranteed to be accurate and should be independently verified.
![]() IDX information is provided exclusively for personal, non-commercial use, and may not be used for any purpose other than to identify prospective properties consumers may be interested in purchasing. Information is deemed reliable but not guaranteed. The content relating to real estate for sale on this web site comes in part from the Broker Reciprocity/ IDX program of the Northern Nevada Regional Multiple Listing Service°. Real estate listings held by brokerage firms other than Ten-X are marked with the Broker Reciprocity logo and detailed information about those listings includes the name of the listing brokerage. Any use of the content other than by a search performed by a consumer looking to purchase or rent real estate is prohibited. © 2025 Northern Nevada Regional Multiple Listing Service® MLS. All rights reserved.
IDX information is provided exclusively for personal, non-commercial use, and may not be used for any purpose other than to identify prospective properties consumers may be interested in purchasing. Information is deemed reliable but not guaranteed. The content relating to real estate for sale on this web site comes in part from the Broker Reciprocity/ IDX program of the Northern Nevada Regional Multiple Listing Service°. Real estate listings held by brokerage firms other than Ten-X are marked with the Broker Reciprocity logo and detailed information about those listings includes the name of the listing brokerage. Any use of the content other than by a search performed by a consumer looking to purchase or rent real estate is prohibited. © 2025 Northern Nevada Regional Multiple Listing Service® MLS. All rights reserved.