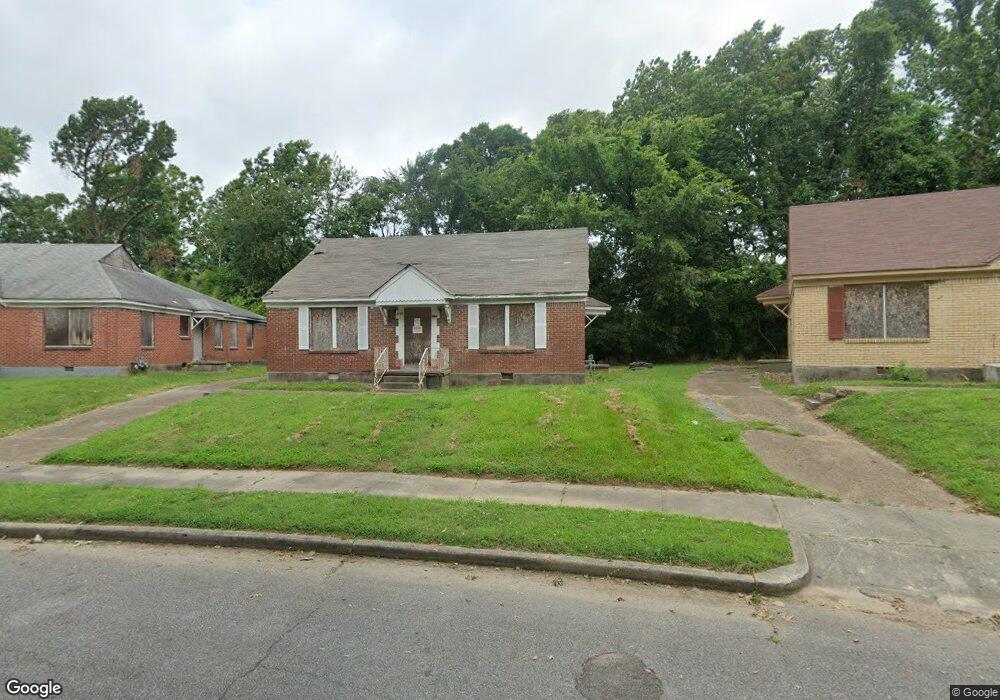
1171 W Lexington Cir Memphis, TN 38107
North Memphis NeighborhoodEstimated Value: $80,000 - $128,000
4
Beds
2
Baths
1,762
Sq Ft
$60/Sq Ft
Est. Value
About This Home
This home is located at 1171 W Lexington Cir, Memphis, TN 38107 and is currently estimated at $106,558, approximately $60 per square foot. 1171 W Lexington Cir is a home located in Shelby County with nearby schools including Vollentine Elementary School, Grandview Heights Middle, and Manassas High School.
Ownership History
Date
Name
Owned For
Owner Type
Purchase Details
Closed on
Jun 30, 2023
Sold by
Brown Lexington Gp
Bought by
Tw1 Jv1 Llc
Current Estimated Value
Purchase Details
Closed on
Mar 20, 2020
Sold by
Smith Quinten L and Shipp Patrice
Bought by
Gp Brown Lexington
Purchase Details
Closed on
Aug 16, 2010
Sold by
Walker Hall Inc
Bought by
Smith Quinten L and Shipp Patrice R
Purchase Details
Closed on
Aug 10, 2010
Sold by
Leake Melvena C
Bought by
Walker Hall Inc
Purchase Details
Closed on
Mar 26, 2010
Sold by
Leake Melvena C
Bought by
Walker Hall Inc
Purchase Details
Closed on
Jul 3, 1996
Sold by
Walker Hall Inc
Bought by
Leake Melvena C
Home Financials for this Owner
Home Financials are based on the most recent Mortgage that was taken out on this home.
Original Mortgage
$22,500
Interest Rate
9%
Mortgage Type
Seller Take Back
Create a Home Valuation Report for This Property
The Home Valuation Report is an in-depth analysis detailing your home's value as well as a comparison with similar homes in the area
Home Values in the Area
Average Home Value in this Area
Purchase History
| Date | Buyer | Sale Price | Title Company |
|---|---|---|---|
| Tw1 Jv1 Llc | -- | None Listed On Document | |
| Gp Brown Lexington | $13,000 | None Available | |
| Smith Quinten L | $26,500 | None Available | |
| Walker Hall Inc | $13,597 | None Available | |
| Walker Hall Inc | $13,597 | None Available | |
| Leake Melvena C | $25,000 | Stewart Title Company |
Source: Public Records
Mortgage History
| Date | Status | Borrower | Loan Amount |
|---|---|---|---|
| Previous Owner | Leake Melvena C | $22,500 |
Source: Public Records
Tax History Compared to Growth
Tax History
| Year | Tax Paid | Tax Assessment Tax Assessment Total Assessment is a certain percentage of the fair market value that is determined by local assessors to be the total taxable value of land and additions on the property. | Land | Improvement |
|---|---|---|---|---|
| 2025 | $540 | $29,440 | $3,600 | $25,840 |
| 2024 | $540 | $15,920 | $1,800 | $14,120 |
| 2023 | $970 | $15,920 | $1,800 | $14,120 |
| 2022 | $970 | $15,920 | $1,800 | $14,120 |
| 2021 | $549 | $15,920 | $1,800 | $14,120 |
| 2020 | $336 | $4,640 | $1,800 | $2,840 |
| 2019 | $148 | $4,640 | $1,800 | $2,840 |
| 2018 | $148 | $4,640 | $1,800 | $2,840 |
| 2017 | $152 | $4,640 | $1,800 | $2,840 |
| 2016 | $411 | $9,400 | $0 | $0 |
| 2014 | $411 | $9,400 | $0 | $0 |
Source: Public Records
Map
Nearby Homes
- 1131 N Watkins St
- 1105 N Watkins St
- 1003 Garland St
- 0 Clyde Ave
- 0 Clyde Ave Unit 10202744
- 1587 Chelsea Ave
- 0 Louisville Ave
- 1338 N Willett St
- 929 N Watkins St
- 1055 N Avalon St
- 929 Garland St
- 937 Speed St
- 934 Alaska St
- 270 Ellawood Ln
- 925 Speed St
- 915 Garland St
- 921 Alaska St
- 995 N Avalon St
- 967 Maury St
- 883 N Watkins St
- 1165 W Lexington Cir
- 1175 W Lexington Cir
- 1161 W Lexington Cir
- 1386 W Lexington Cir
- 1164 W Lexington Cir
- 1372 N Lexington Cir
- 1157 W Lexington Cir
- 1379 N Lexington Cir
- 1158 W Lexington Cir
- 1378 N Lexington Cir
- 1151 W Lexington Cir
- 1385 N Lexington Cir
- 1148 W Lexington Cir
- 1388 N Lexington Cir
- 1386 N Lexington Cir
- 1145 W Lexington Cir
- 1389 N Lexington Cir
- 1144 W Lexington Cir
- 1141 W Lexington Cir
- 1396 N Lexington Cir