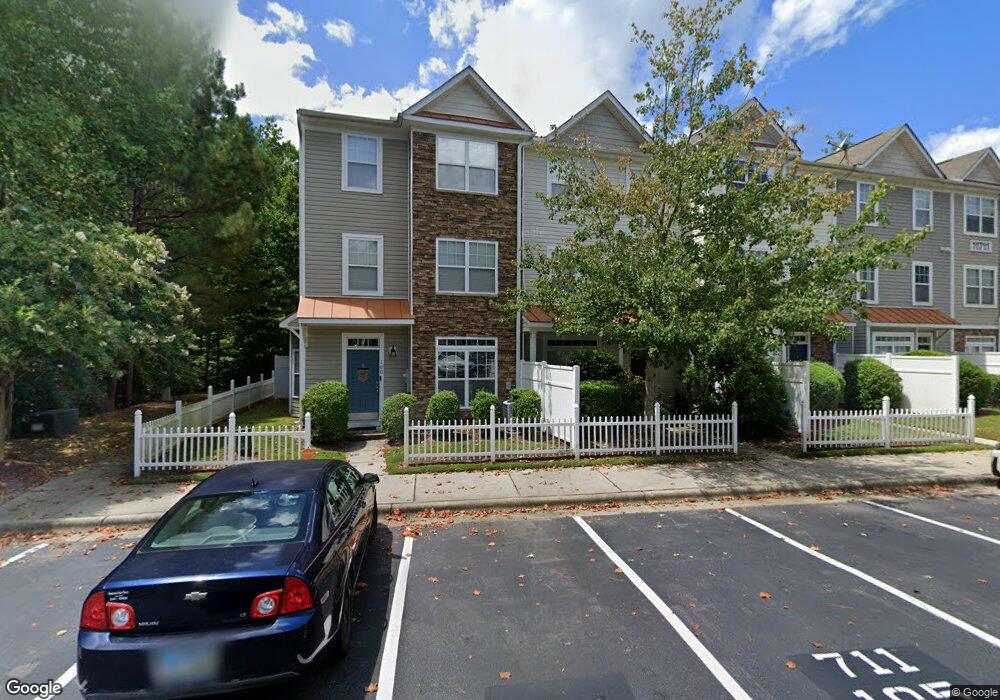
11711 Mezzanine Dr Unit 114 Raleigh, NC 27614
Falls Lake NeighborhoodEstimated Value: $269,000 - $276,000
3
Beds
3
Baths
1,753
Sq Ft
$156/Sq Ft
Est. Value
About This Home
This home is located at 11711 Mezzanine Dr Unit 114, Raleigh, NC 27614 and is currently estimated at $273,643, approximately $156 per square foot. 11711 Mezzanine Dr Unit 114 is a home located in Wake County with nearby schools including Forest Pines Drive Elementary School, Wake Forest-Rolesville Middle School, and Wakefield High School.
Ownership History
Date
Name
Owned For
Owner Type
Purchase Details
Closed on
Feb 25, 2021
Sold by
Carbellano Mario L and Carbellano Denise
Bought by
Carey Bethany Lee
Current Estimated Value
Home Financials for this Owner
Home Financials are based on the most recent Mortgage that was taken out on this home.
Original Mortgage
$194,000
Outstanding Balance
$173,907
Interest Rate
2.7%
Mortgage Type
New Conventional
Estimated Equity
$99,736
Purchase Details
Closed on
May 18, 2007
Sold by
Tidewater Land Llc
Bought by
Carbellano Mario L and Carbellano Denise
Home Financials for this Owner
Home Financials are based on the most recent Mortgage that was taken out on this home.
Original Mortgage
$135,650
Interest Rate
6.12%
Mortgage Type
Unknown
Create a Home Valuation Report for This Property
The Home Valuation Report is an in-depth analysis detailing your home's value as well as a comparison with similar homes in the area
Home Values in the Area
Average Home Value in this Area
Purchase History
| Date | Buyer | Sale Price | Title Company |
|---|---|---|---|
| Carey Bethany Lee | $220,000 | Bridge Trust Title Group | |
| Carbellano Mario L | $170,000 | None Available |
Source: Public Records
Mortgage History
| Date | Status | Borrower | Loan Amount |
|---|---|---|---|
| Open | Carey Bethany Lee | $194,000 | |
| Previous Owner | Carbellano Mario L | $135,650 |
Source: Public Records
Tax History Compared to Growth
Tax History
| Year | Tax Paid | Tax Assessment Tax Assessment Total Assessment is a certain percentage of the fair market value that is determined by local assessors to be the total taxable value of land and additions on the property. | Land | Improvement |
|---|---|---|---|---|
| 2025 | $2,514 | $285,974 | $50,000 | $235,974 |
| 2024 | $2,504 | $285,974 | $50,000 | $235,974 |
| 2023 | $1,902 | $172,648 | $30,000 | $142,648 |
| 2022 | $1,768 | $172,648 | $30,000 | $142,648 |
| 2021 | $1,700 | $172,648 | $30,000 | $142,648 |
| 2020 | $1,669 | $172,648 | $30,000 | $142,648 |
| 2019 | $1,423 | $121,060 | $12,000 | $109,060 |
| 2018 | $1,343 | $121,060 | $12,000 | $109,060 |
| 2017 | $1,279 | $121,060 | $12,000 | $109,060 |
| 2016 | $1,253 | $121,060 | $12,000 | $109,060 |
| 2015 | $1,578 | $150,414 | $32,000 | $118,414 |
| 2014 | $1,497 | $150,414 | $32,000 | $118,414 |
Source: Public Records
Map
Nearby Homes
- 11710 Mezzanine Dr Unit 111
- 11720 Mezzanine Dr Unit 103
- 12014 Fox Valley St
- 12217 Beestone Ln
- 403 Belgian Red Way
- 407 Belgian Red Way
- 409 Belgian Red Way
- 413 Belgian Red Way
- 414 Belgian Red Way
- 415 Belgian Red Way
- 416 Belgian Red Way
- 417 Belgian Red Way
- 420 Belgian Red Way
- 419 Belgian Red Way
- 423 Belgian Red Way
- 425 Belgian Red Way
- 427 Belgian Red Way
- 429 Belgian Red Way
- 3005 Osterley St
- 11711 Mezzanine Dr
- 11711 Mezzanine Dr Unit 106
- 11711 Mezzanine Dr Unit 104
- 11711 Mezzanine Dr Unit 112
- 11711 Mezzanine Dr Unit 110
- 11711 Mezzanine Dr Unit 108
- 11711 Mezzanine Dr Unit 102
- 11711 Mezzanine Dr Unit 100
- 11711 Mezzanine Dr Unit 105
- 11711 Mezzanine Dr Unit 103
- 11711 Mezzanine Dr Unit 101
- 11711 Mezzanine Dr Unit 113
- 11711 Mezzanine Dr Unit 111
- 11711 Mezzanine Dr Unit 109
- 11711 Mezzanine Dr Unit 107
- 11711 Mezzanine Dr Unit 115
- 11711 Mezzanine Dr
- 11710 Mezzanine Dr
- 11710 Mezzanine Dr Unit 101
- 11710 Mezzanine Dr Unit 103