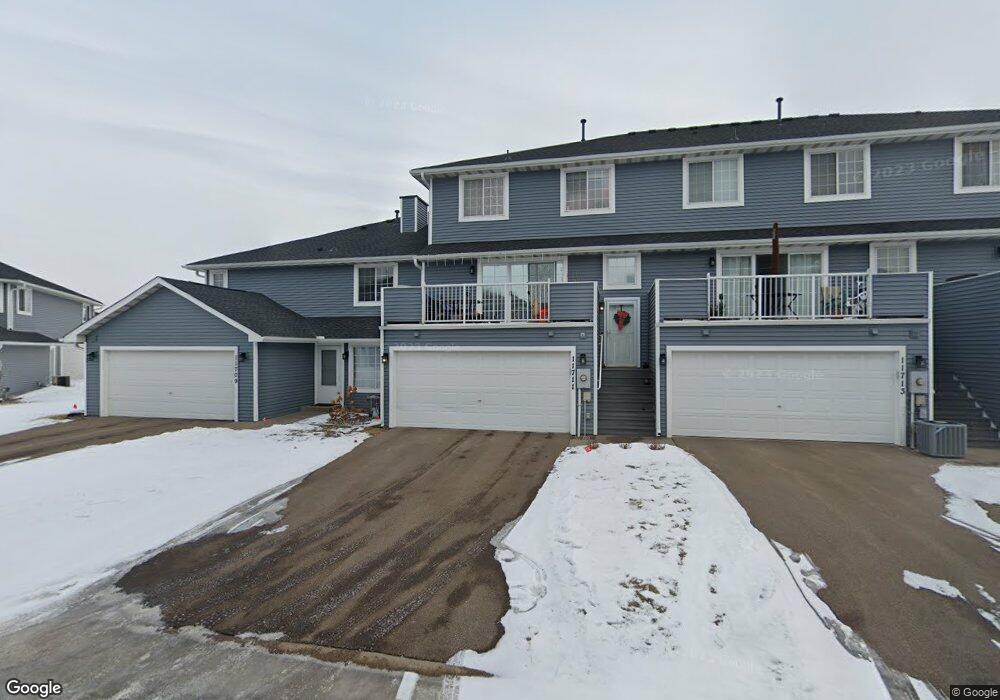
11711 Millpond Ave Burnsville, MN 55337
Estimated Value: $240,518 - $249,000
2
Beds
2
Baths
1,419
Sq Ft
$172/Sq Ft
Est. Value
About This Home
This home is located at 11711 Millpond Ave, Burnsville, MN 55337 and is currently estimated at $244,130, approximately $172 per square foot. 11711 Millpond Ave is a home located in Dakota County with nearby schools including Burnsville High School, Gateway STEM Academy, and Sunrise International Montessori School.
Ownership History
Date
Name
Owned For
Owner Type
Purchase Details
Closed on
Jul 16, 2025
Sold by
State Of Minnesota
Bought by
City Of Burnsville
Current Estimated Value
Purchase Details
Closed on
Apr 5, 2019
Sold by
Moore Matthew and Moore Teresa Solberg
Bought by
Osborne Scott Vincent and Osborne Jaquelyn
Purchase Details
Closed on
Aug 24, 2007
Sold by
Divalle Joseph E and Divalle Alexis
Bought by
Moore Teresa Solberg and Moore Matthew
Purchase Details
Closed on
Feb 14, 2003
Sold by
Empey Brett A
Bought by
Dvalle Joseph Everett
Purchase Details
Closed on
Nov 30, 2000
Sold by
Krueger Steven J and Krueger Heidi
Bought by
Empey Brett A
Purchase Details
Closed on
May 27, 1999
Sold by
Besser Brice D and Besser Jennifer F
Bought by
Krueger Steven J
Purchase Details
Closed on
Jul 2, 1997
Sold by
Finke Development And Investment Group
Bought by
Delta Development Inc
Create a Home Valuation Report for This Property
The Home Valuation Report is an in-depth analysis detailing your home's value as well as a comparison with similar homes in the area
Home Values in the Area
Average Home Value in this Area
Purchase History
| Date | Buyer | Sale Price | Title Company |
|---|---|---|---|
| City Of Burnsville | -- | None Listed On Document | |
| Osborne Scott Vincent | $177,000 | Dca Title | |
| Moore Teresa Solberg | $168,250 | -- | |
| Dvalle Joseph Everett | $166,500 | -- | |
| Empey Brett A | $135,000 | -- | |
| Krueger Steven J | $112,550 | -- | |
| Delta Development Inc | $5,000 | -- | |
| Besser Brice D | $90,290 | -- |
Source: Public Records
Tax History Compared to Growth
Tax History
| Year | Tax Paid | Tax Assessment Tax Assessment Total Assessment is a certain percentage of the fair market value that is determined by local assessors to be the total taxable value of land and additions on the property. | Land | Improvement |
|---|---|---|---|---|
| 2024 | $2,056 | $195,700 | $37,000 | $158,700 |
| 2023 | $2,056 | $209,600 | $37,100 | $172,500 |
| 2022 | $1,772 | $193,100 | $37,000 | $156,100 |
| 2021 | $1,696 | $181,800 | $32,200 | $149,600 |
| 2020 | $1,576 | $167,200 | $30,700 | $136,500 |
| 2019 | $1,571 | $152,400 | $29,200 | $123,200 |
| 2018 | $1,465 | $145,700 | $27,000 | $118,700 |
| 2017 | $1,412 | $134,100 | $25,000 | $109,100 |
| 2016 | $1,371 | $129,000 | $23,800 | $105,200 |
| 2015 | $1,216 | $95,849 | $18,134 | $77,715 |
| 2014 | -- | $87,892 | $16,614 | $71,278 |
| 2013 | -- | $77,646 | $14,218 | $63,428 |
Source: Public Records
Map
Nearby Homes
- 2200 Horizon Rd
- 11900 Highland View Cir
- 3017 Mcleod St
- 2329 Explorer Ct
- 1853 Riverwood Dr Unit 4
- 1800 Riverwood Dr Unit 110
- 1800 Riverwood Dr Unit 323
- 11311 W River Hills Dr
- 11902 River Hills Cir
- 11921 Baypoint Dr
- 2001 Woods Ln
- 1601 Raleigh Dr
- 11036 27th Ave S
- 11459 Galtier Dr
- 11115 Carver Ct
- 11017 27th Ave S
- 3309 Red Oak Cir N
- 1609 Riverwood Dr
- 10934 Southview Dr
- 2005 E 122nd St Unit A7
- 11775 Millpond Ave Unit 101
- 11773 Millpond Ave Unit 100
- 11771 Millpond Ave Unit 99
- 11739 Millpond Ave
- 11669 Millpond Ave
- 11673 Millpond Ave
- 11651 Millpond Ave
- 11657 Millpond Ave
- 2333 E 117th St Unit 33
- 2417 E 117th St
- 2449 E 117th St Unit 24
- 2547 E 117th St
- 11657 Millpond Ave Unit 43
- 2417 E 117th St Unit 28
- 2465 E 117th St
- 11671 Millpond Ave
- 11671 Millpond Ave Unit 157
- 11685 Millpond Ave Unit 63
- 11687 Millpond Ave
- 11687 Millpond Ave Unit 64