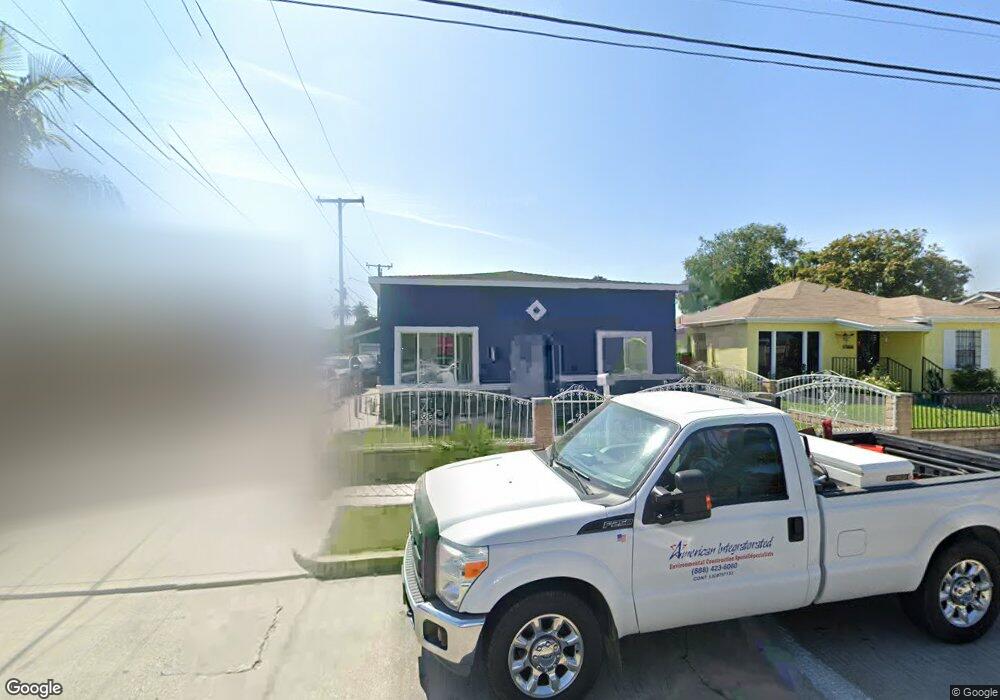
11711 Peach St Lynwood, CA 90262
Estimated Value: $711,523 - $735,000
3
Beds
2
Baths
1,429
Sq Ft
$508/Sq Ft
Est. Value
About This Home
This home is located at 11711 Peach St, Lynwood, CA 90262 and is currently estimated at $725,881, approximately $507 per square foot. 11711 Peach St is a home located in Los Angeles County with nearby schools including Lindbergh Elementary School, Lynwood Middle School, and Marco Antonio Firebaugh High School.
Ownership History
Date
Name
Owned For
Owner Type
Purchase Details
Closed on
Feb 21, 2013
Sold by
Gutierrez Benjamin
Bought by
Gutierrez Benjamin and Gutierrez Marisela
Current Estimated Value
Home Financials for this Owner
Home Financials are based on the most recent Mortgage that was taken out on this home.
Original Mortgage
$255,821
Outstanding Balance
$186,555
Interest Rate
4.37%
Mortgage Type
FHA
Estimated Equity
$539,326
Purchase Details
Closed on
Oct 25, 2008
Sold by
Travis Jane Vanessa
Bought by
Gutierrez Benjamin and Gutierrez Marisela
Home Financials for this Owner
Home Financials are based on the most recent Mortgage that was taken out on this home.
Original Mortgage
$266,483
Interest Rate
5.77%
Mortgage Type
FHA
Purchase Details
Closed on
Oct 27, 2000
Sold by
Hildreth Johnnie M
Bought by
Travis Jane Vanessa
Home Financials for this Owner
Home Financials are based on the most recent Mortgage that was taken out on this home.
Original Mortgage
$157,916
Interest Rate
7.9%
Mortgage Type
FHA
Create a Home Valuation Report for This Property
The Home Valuation Report is an in-depth analysis detailing your home's value as well as a comparison with similar homes in the area
Home Values in the Area
Average Home Value in this Area
Purchase History
| Date | Buyer | Sale Price | Title Company |
|---|---|---|---|
| Gutierrez Benjamin | -- | Fidelity National Title Co | |
| Gutierrez Benjamin | $270,000 | Commonwealth Land Title Co | |
| Travis Jane Vanessa | $160,000 | Commonwealth Title |
Source: Public Records
Mortgage History
| Date | Status | Borrower | Loan Amount |
|---|---|---|---|
| Open | Gutierrez Benjamin | $255,821 | |
| Closed | Gutierrez Benjamin | $266,483 | |
| Previous Owner | Travis Jane Vanessa | $157,916 | |
| Closed | Travis Jane Vanessa | $4,800 |
Source: Public Records
Tax History Compared to Growth
Tax History
| Year | Tax Paid | Tax Assessment Tax Assessment Total Assessment is a certain percentage of the fair market value that is determined by local assessors to be the total taxable value of land and additions on the property. | Land | Improvement |
|---|---|---|---|---|
| 2025 | $5,015 | $336,377 | $189,020 | $147,357 |
| 2024 | $5,015 | $329,782 | $185,314 | $144,468 |
| 2023 | $4,979 | $323,317 | $181,681 | $141,636 |
| 2022 | $4,805 | $316,978 | $178,119 | $138,859 |
| 2021 | $4,632 | $310,764 | $174,627 | $136,137 |
| 2019 | $4,739 | $301,549 | $169,449 | $132,100 |
| 2018 | $4,343 | $295,637 | $166,127 | $129,510 |
| 2016 | $4,052 | $284,159 | $159,677 | $124,482 |
| 2015 | $3,973 | $279,892 | $157,279 | $122,613 |
| 2014 | $3,884 | $274,411 | $154,199 | $120,212 |
Source: Public Records
Map
Nearby Homes
- 3234 Cedar Ave
- 11952 Santa fe Ave
- 3276 Cedar Ave
- 3370 Josephine St
- 2975 Fernwood Ave
- 12008 Long Beach Blvd
- 536 E El Segundo Blvd
- 11464 Copeland St
- 11460 Copeland St
- 3617 Cedar Ave
- 12434 Peach St Unit A-B
- 2618 E 124th St
- 3226 Palm Ave
- 2623 E 127th St
- 3644 Platt Ave
- 3323 Los Flores Blvd
- 11141 Franklin St
- 3685 Fernwood Ave
- 3382 Los Flores Blvd
- 3130 Euclid Ave
- 11717 Peach St
- 11721 Peach St
- 11701 Peach St
- 3151 Josephine St
- 3160 Louise St
- 11725 Peach St
- 3147 Josephine St
- 11714 Peach St
- 11718 Peach St
- 11708 Peach St
- 3154 Louise St
- 11720 Peach St
- 3204 Louise St
- 3143 Josephine St
- 11724 Peach St
- 11625 Peach St
- 3148 Louise St
- 3139 Josephine St
- 11730 Peach St
- 11713 Monrovia Ave