Estimated Value: $773,000 - $978,000
6
Beds
4
Baths
4,496
Sq Ft
$202/Sq Ft
Est. Value
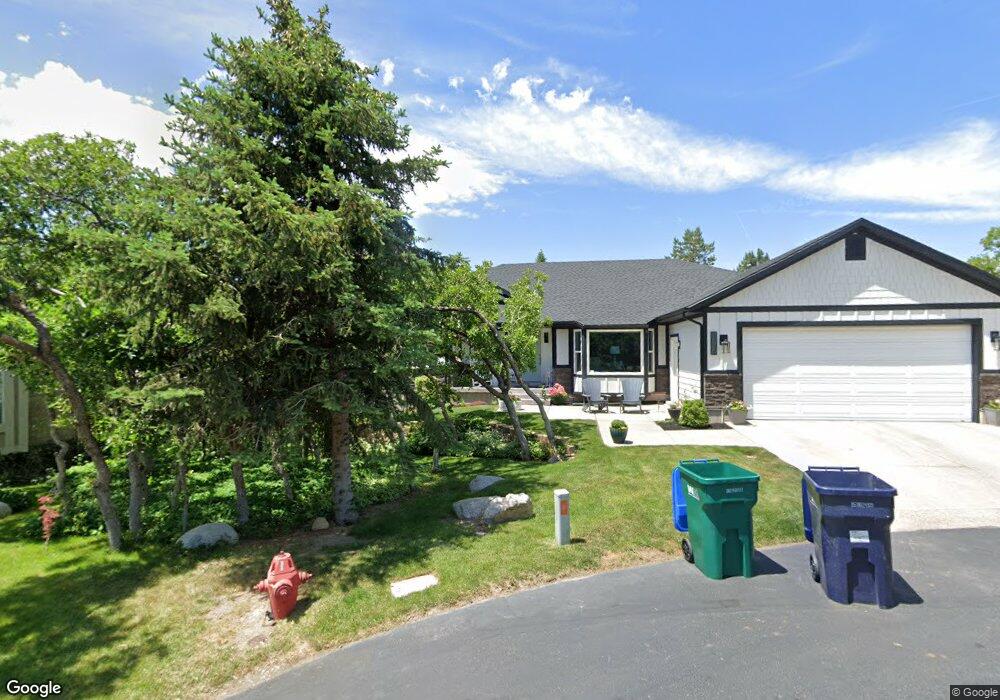
About This Home
This home is located at 11714 S Gambel Oak Cir, Sandy, UT 84092 and is currently estimated at $907,729, approximately $201 per square foot. 11714 S Gambel Oak Cir is a home located in Salt Lake County with nearby schools including Bell Canyon Montessori School and Gateway Academy.
Ownership History
Date
Name
Owned For
Owner Type
Purchase Details
Closed on
Apr 11, 2022
Sold by
Charlesworth Bret G
Bought by
Charlesworth Family Trust
Current Estimated Value
Home Financials for this Owner
Home Financials are based on the most recent Mortgage that was taken out on this home.
Original Mortgage
$500,000
Outstanding Balance
$471,918
Interest Rate
4.72%
Mortgage Type
New Conventional
Estimated Equity
$435,811
Purchase Details
Closed on
Jan 13, 2021
Sold by
Charlesworth Bret and Charlesworth Sheree
Bought by
Charlesworth Bret G and Charlesworth Sheree H
Home Financials for this Owner
Home Financials are based on the most recent Mortgage that was taken out on this home.
Original Mortgage
$110,000
Interest Rate
2.71%
Mortgage Type
New Conventional
Purchase Details
Closed on
Jul 23, 2018
Sold by
Armstrong Brett G and Armstrong Leslie K
Bought by
Charlesworth Bret G and Charlesworth Sheree H
Purchase Details
Closed on
Dec 29, 2014
Sold by
Federal National Mortgage Association
Bought by
Armstrong Brett G and Armstrong Leslie K
Home Financials for this Owner
Home Financials are based on the most recent Mortgage that was taken out on this home.
Original Mortgage
$288,000
Interest Rate
3.92%
Mortgage Type
New Conventional
Purchase Details
Closed on
Sep 4, 2014
Sold by
Nilsson Michael J and Nilsson Monique M
Bought by
Federal National Mortgage Association
Purchase Details
Closed on
Feb 23, 2006
Sold by
Triggpac Lp
Bought by
Nilsson Michael J and Nilsson Monique M
Home Financials for this Owner
Home Financials are based on the most recent Mortgage that was taken out on this home.
Original Mortgage
$346,400
Interest Rate
6.15%
Mortgage Type
Unknown
Purchase Details
Closed on
Jun 7, 2005
Sold by
Barnes Scott
Bought by
Triggpac Lp
Purchase Details
Closed on
May 22, 1998
Sold by
Kearl Clayton F
Bought by
Kearl Clayton F
Purchase Details
Closed on
May 1, 1998
Sold by
Leap Frog Trust
Bought by
Kearl Clayton F
Create a Home Valuation Report for This Property
The Home Valuation Report is an in-depth analysis detailing your home's value as well as a comparison with similar homes in the area
Home Values in the Area
Average Home Value in this Area
Purchase History
| Date | Buyer | Sale Price | Title Company |
|---|---|---|---|
| Charlesworth Family Trust | -- | Vanguard Title | |
| Charlesworth Bret G | -- | Vanguard Title | |
| Charlesworth Bret G | -- | Vanguard Title Union Park | |
| Charlesworth Bret | -- | Vanguard Title Union Park | |
| Charlesworth Bret G | -- | Meridian Title | |
| Armstrong Brett G | -- | Backman Title Services | |
| Federal National Mortgage Association | $401,894 | Etitle Insurance Agency | |
| Nilsson Michael J | -- | Us Title Of Utah | |
| Triggpac Lp | $327,100 | -- | |
| Kearl Clayton F | -- | Superior Title Company | |
| Kearl Clayton F | -- | Superior Title Company |
Source: Public Records
Mortgage History
| Date | Status | Borrower | Loan Amount |
|---|---|---|---|
| Open | Charlesworth Bret G | $500,000 | |
| Previous Owner | Charlesworth Bret | $110,000 | |
| Previous Owner | Armstrong Brett G | $288,000 | |
| Previous Owner | Nilsson Michael J | $346,400 |
Source: Public Records
Tax History Compared to Growth
Tax History
| Year | Tax Paid | Tax Assessment Tax Assessment Total Assessment is a certain percentage of the fair market value that is determined by local assessors to be the total taxable value of land and additions on the property. | Land | Improvement |
|---|---|---|---|---|
| 2025 | $4,039 | $799,000 | $281,700 | $517,300 |
| 2024 | $4,039 | $763,600 | $271,200 | $492,400 |
| 2023 | $3,891 | $735,000 | $260,800 | $474,200 |
| 2022 | $4,016 | $741,800 | $255,600 | $486,200 |
| 2021 | $3,485 | $548,200 | $198,800 | $349,400 |
| 2020 | $3,430 | $509,400 | $198,800 | $310,600 |
| 2019 | $3,449 | $478,500 | $187,600 | $290,900 |
| 2018 | $2,866 | $434,500 | $187,600 | $246,900 |
| 2017 | $2,965 | $430,200 | $187,600 | $242,600 |
| 2016 | $2,737 | $384,200 | $169,000 | $215,200 |
| 2015 | $3,449 | $448,900 | $164,900 | $284,000 |
| 2014 | $3,603 | $460,700 | $164,900 | $295,800 |
Source: Public Records
Map
Nearby Homes
- 2412 Bear Hill Dr S
- 2234 E Willow Brook Way
- 11939 S Hidden Canyon Ln
- 15 Lone Hollow Dr
- 1937 Wasatch Blvd
- 98 E Lone Hollow Dr S Unit 902
- 11551 S Woodhampton Dr Unit 2
- 2022 Tall Pines Way
- 2026 E Tivoli Hills Ct
- 1 Cross Hill Ln
- 89 Lone Hollow Dr Unit 1026
- 2019 E Graystone Ct
- 11778 S 1700 E
- 81 E Lone Hollow
- 12182 S Pine Valley Way
- 5 Quietwood Ln
- 39 Northridge Way
- 1644 Pebble Beach Cir
- 15 Bentwood Ln S Unit 1117
- 1612 E Hidden Valley Rd
- 11714 Gambel Oak Cir
- 11726 S Gambel Oak Cir
- 11726 Gambel Oak Cir
- 11713 Gambel Oak Cir
- 11713 S Gambel Oak Cir
- 11717 Oak Leaf Place
- 11717 S Oak Leaf Place
- 11729 Oak Leaf Place
- 11729 S Oak Leaf Place
- 2273 E Oak Leaf Way
- 2279 Wasatch Blvd
- 2267 Wasatch Blvd
- 2273 Oak Leaf Way
- 2267 E Wasatch Blvd
- 11725 Gambel Oak Cir
- 2279 E 11700 S
- 11735 Gambel Oak Cir
- 11741 Oak Leaf Place
- 11712 Oak Leaf Place
- 2291 E Wasatch Blvd