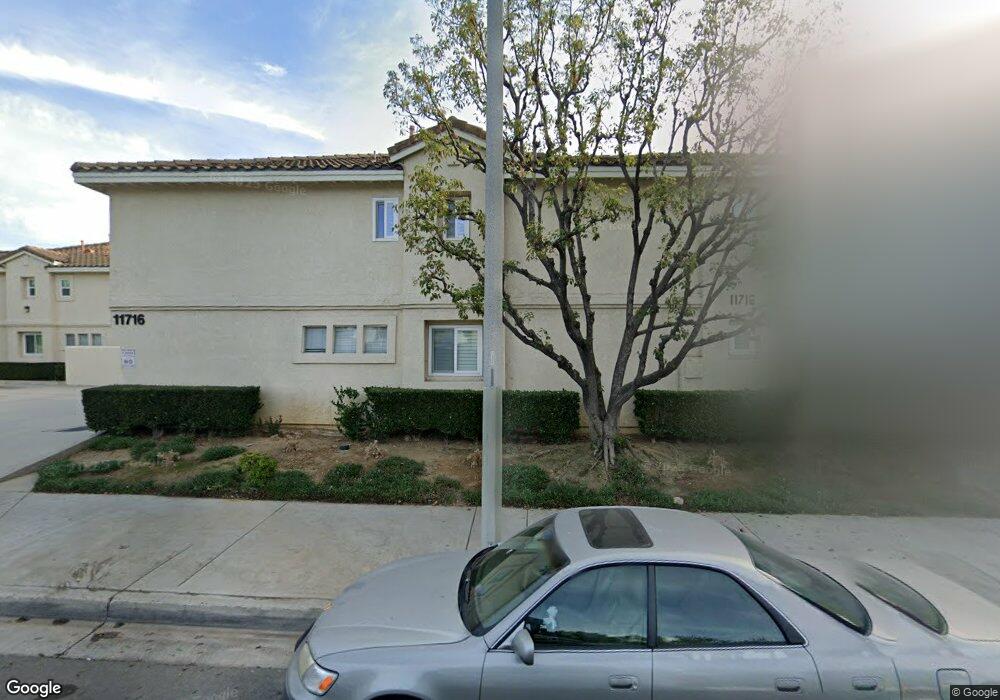
11716 Valley View Ave Unit 20A Whittier, CA 90604
South Whittier NeighborhoodEstimated Value: $615,000 - $747,000
3
Beds
3
Baths
1,268
Sq Ft
$520/Sq Ft
Est. Value
About This Home
This home is located at 11716 Valley View Ave Unit 20A, Whittier, CA 90604 and is currently estimated at $659,767, approximately $520 per square foot. 11716 Valley View Ave Unit 20A is a home located in Los Angeles County with nearby schools including California High School, St. Gregory The Great, and St. Paul Of The Cross Elementary School.
Ownership History
Date
Name
Owned For
Owner Type
Purchase Details
Closed on
Dec 21, 2009
Sold by
Nisbett Craig Robert
Bought by
Ung Thomas Heng and Ung Kelly K
Current Estimated Value
Home Financials for this Owner
Home Financials are based on the most recent Mortgage that was taken out on this home.
Original Mortgage
$120,000
Interest Rate
5.11%
Mortgage Type
Purchase Money Mortgage
Purchase Details
Closed on
Jun 10, 1999
Sold by
Sullivan John N
Bought by
Nisbett Craig Robert
Home Financials for this Owner
Home Financials are based on the most recent Mortgage that was taken out on this home.
Original Mortgage
$138,924
Interest Rate
7.64%
Mortgage Type
Purchase Money Mortgage
Create a Home Valuation Report for This Property
The Home Valuation Report is an in-depth analysis detailing your home's value as well as a comparison with similar homes in the area
Home Values in the Area
Average Home Value in this Area
Purchase History
| Date | Buyer | Sale Price | Title Company |
|---|---|---|---|
| Ung Thomas Heng | $240,000 | North American Title Company | |
| Nisbett Craig Robert | $143,000 | Southland Title |
Source: Public Records
Mortgage History
| Date | Status | Borrower | Loan Amount |
|---|---|---|---|
| Previous Owner | Ung Thomas Heng | $120,000 | |
| Previous Owner | Nisbett Craig Robert | $138,924 |
Source: Public Records
Tax History Compared to Growth
Tax History
| Year | Tax Paid | Tax Assessment Tax Assessment Total Assessment is a certain percentage of the fair market value that is determined by local assessors to be the total taxable value of land and additions on the property. | Land | Improvement |
|---|---|---|---|---|
| 2025 | $3,870 | $309,780 | $93,187 | $216,593 |
| 2024 | $3,870 | $303,707 | $91,360 | $212,347 |
| 2023 | $3,750 | $297,753 | $89,569 | $208,184 |
| 2022 | $3,772 | $291,915 | $87,813 | $204,102 |
| 2021 | $3,691 | $286,192 | $86,092 | $200,100 |
| 2019 | $3,623 | $277,706 | $83,540 | $194,166 |
| 2018 | $3,514 | $272,261 | $81,902 | $190,359 |
| 2016 | $3,335 | $261,691 | $78,723 | $182,968 |
| 2015 | $3,251 | $257,761 | $77,541 | $180,220 |
| 2014 | $3,220 | $252,713 | $76,023 | $176,690 |
Source: Public Records
Map
Nearby Homes
- 11624 Starlight Ave
- 0 Telegraph Rd Unit DW24244539
- 11813 Colima Rd
- 14034 Coteau Dr Unit 1103
- 14135 Chere Dr
- 11531 Sunnybrook Ln
- 12212 Corley Dr
- 13857 Leffingwell Rd
- 11522 Double Eagle Dr
- 11502 Double Eagle Dr
- 10955 Parise Dr
- 11118 Bunker Ln
- 14036 Lake View Dr Unit 143
- 12309 Ramsey Dr
- 11102 Eagle Ln
- 14000 Lake View Dr
- 14243 Gagely Dr
- 12726 Lake Forest Ave Unit 25
- 14246 Gagely Dr
- 11111 Colima Rd
- 11708 Valley View Ave Unit A
- 11708 Valley View Ave Unit B
- 11708 Valley View Ave Unit C
- 11708 Valley View Ave Unit D
- 11716 Valley View Ave Unit 19B
- 11716 Valley View Ave Unit 18C
- 11716 Valley View Ave Unit D
- 11716 Valley View Ave Unit E
- 11716 Valley View Ave Unit F
- 11628 Valley View Ave Unit 4C
- 11710 Valley View Ave Unit C
- 11710 Valley View Ave Unit D
- 11628 Valley View Ave Unit A
- 11628 Valley View Ave Unit B
- 11628 Valley View Ave Unit C
- 11628 Valley View Ave Unit E
- 11628 Valley View Ave Unit F
- 11710 Valley View Ave Unit A
- 11710 Valley View Ave Unit B
- 11719 Chadsey Dr