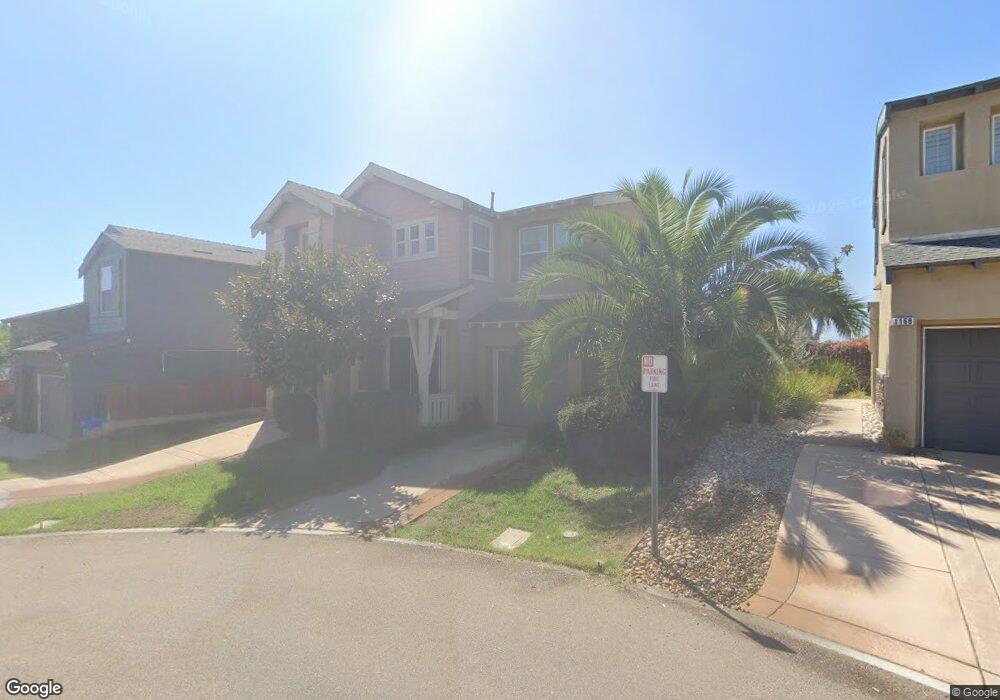
1172 Kava Ct Encinitas, CA 92024
Central Encinitas NeighborhoodEstimated Value: $1,646,337 - $2,067,000
3
Beds
3
Baths
1,993
Sq Ft
$961/Sq Ft
Est. Value
About This Home
This home is located at 1172 Kava Ct, Encinitas, CA 92024 and is currently estimated at $1,916,084, approximately $961 per square foot. 1172 Kava Ct is a home located in San Diego County with nearby schools including Ocean Knoll Elementary School, Oak Crest Middle School, and La Costa Canyon High School.
Ownership History
Date
Name
Owned For
Owner Type
Purchase Details
Closed on
Feb 5, 2010
Sold by
Wells Fargo Bank Na
Bought by
Li Mitchell M and Lee Lilian T
Current Estimated Value
Home Financials for this Owner
Home Financials are based on the most recent Mortgage that was taken out on this home.
Original Mortgage
$519,842
Outstanding Balance
$343,531
Interest Rate
5%
Mortgage Type
Seller Take Back
Estimated Equity
$1,572,553
Purchase Details
Closed on
Dec 3, 2009
Sold by
Walmsley Jonathan Matthew and Walmsley Stephanie Gagnon
Bought by
Wells Fargo Bank Na
Purchase Details
Closed on
Apr 24, 2007
Sold by
Bluewater Encinitas Llc
Bought by
Walmsley Jonathan Matthew and Walmsley Stephanie Gagnon
Home Financials for this Owner
Home Financials are based on the most recent Mortgage that was taken out on this home.
Original Mortgage
$700,000
Interest Rate
6.25%
Mortgage Type
Purchase Money Mortgage
Create a Home Valuation Report for This Property
The Home Valuation Report is an in-depth analysis detailing your home's value as well as a comparison with similar homes in the area
Home Values in the Area
Average Home Value in this Area
Purchase History
| Date | Buyer | Sale Price | Title Company |
|---|---|---|---|
| Li Mitchell M | $670,000 | Service Link | |
| Wells Fargo Bank Na | $615,000 | Accommodation | |
| Walmsley Jonathan Matthew | $875,000 | Chicago Title Co |
Source: Public Records
Mortgage History
| Date | Status | Borrower | Loan Amount |
|---|---|---|---|
| Open | Li Mitchell M | $519,842 | |
| Previous Owner | Walmsley Jonathan Matthew | $700,000 |
Source: Public Records
Tax History
| Year | Tax Paid | Tax Assessment Tax Assessment Total Assessment is a certain percentage of the fair market value that is determined by local assessors to be the total taxable value of land and additions on the property. | Land | Improvement |
|---|---|---|---|---|
| 2025 | $9,507 | $864,703 | $529,148 | $335,555 |
| 2024 | $9,507 | $847,749 | $518,773 | $328,976 |
| 2023 | $9,242 | $831,127 | $508,601 | $322,526 |
| 2022 | $9,055 | $814,831 | $498,629 | $316,202 |
| 2021 | $8,941 | $798,854 | $488,852 | $310,002 |
| 2020 | $8,875 | $790,664 | $483,840 | $306,824 |
| 2019 | $8,700 | $775,161 | $474,353 | $300,808 |
| 2018 | $8,541 | $759,962 | $465,052 | $294,910 |
| 2017 | $8,407 | $745,062 | $455,934 | $289,128 |
| 2016 | $8,124 | $730,454 | $446,995 | $283,459 |
| 2015 | $7,987 | $719,483 | $440,281 | $279,202 |
| 2014 | $7,856 | $705,390 | $431,657 | $273,733 |
Source: Public Records
Map
Nearby Homes
- 1011 Monterey Vista Way
- 1025 Monterey Vista Way
- 733 Cathy Ln
- 1386 Lake Dr
- 1010 Scarlet Way
- 1280 Santa fe Dr
- 1044 Arcadia Rd
- 760 Bonita Dr
- 1503 Villa Cardiff Dr
- 926 Nolbey St
- 0 Crest Dr Unit 250045003
- 935 Encinitas Blvd
- 405 Requeza St Unit H9
- 407 Requeza St Unit E9
- 224 Seeman Dr
- 948 Emma Dr
- 1240 Berryman Canyon
- 1839 Freda Ln
- 1180 Devonshire Dr
- 2034-36 Mackinnon Ave
- 1176 Kava Ct
- 1168 Kava Ct
- 1164 Kava Ct
- 1173 Kava Ct
- 1169 Kava Ct
- 1160 Kava Ct
- 1165 Kava Ct
- 1158 Evergreen Dr
- 1204 Blue Sky Dr
- 1156 Kava Ct
- 1206 Blue Sky Dr
- 1205 Blue Sky Dr
- 1154 Evergreen Dr
- 1006 Santa fe Dr
- 1008 Santa fe Dr
- 1210 Blue Sky Dr
- 1215 Blue Sky Dr
- 937 Santa fe Dr
- 1146 Evergreen Dr
- 1175 Evergreen Dr
Your Personal Tour Guide
Ask me questions while you tour the home.