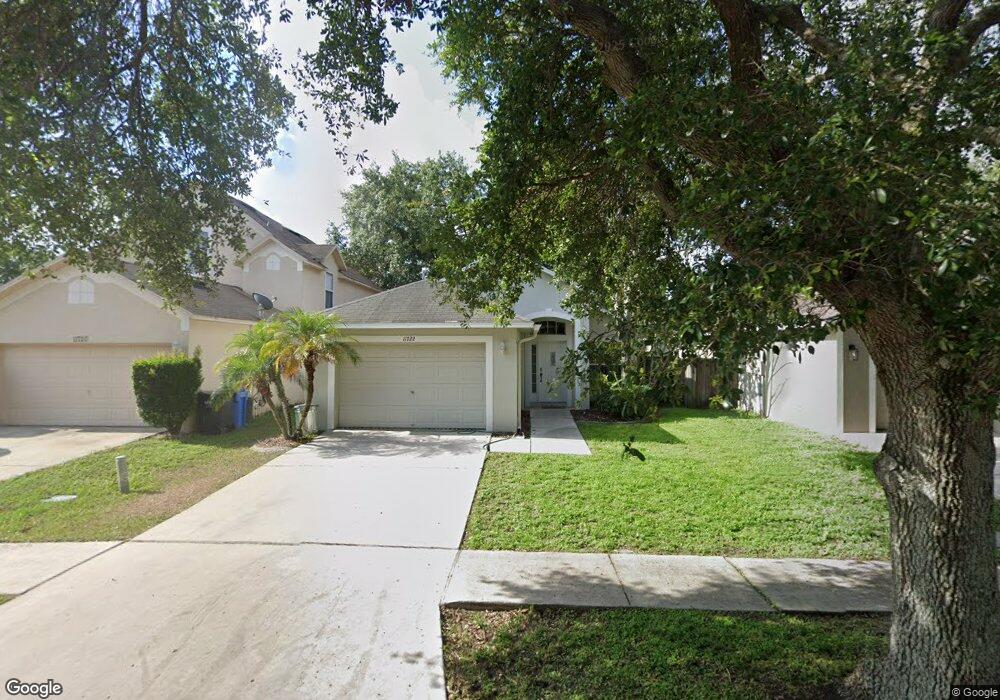
11722 Mango Cross Ct Seffner, FL 33584
Estimated Value: $282,482 - $302,000
About This Home
Please note, our homes are available on a first-come, first-serve basis and are not reserved until the lease is signed by all applicants and security deposits are collected.
This home features Progress Smart Home - Progress Residential's smart home app, which allows you to control the home securely from any of your devices. Learn more at
Rent this home by March 2, 2026 and receive $500.
Want to tour on your own? Click the “Self Tour” button on this home’s listing or call to register for a self-guided showing at a time that works best for you.
Interested in this home? You clearly have exceptional taste. This charming 3-bedroom, 2.0-bathroom home is not only pet-friendly, but also equipped with smart home features to make everyday life more convenient and connected. Homes like this don’t stay on the market for long—don’t miss your chance to make it yours. Apply today!
The Homeowners Association (HOA) for this home has a separate application process that applicants will need to complete in addition to Progress Residential's application. This includes self-registering with the HOA, completing the HOA's approval process, and paying any fees required by the HOA.
Some images have been virtually staged to help showcase the potential of spaces in the home. The furnishings shown are for illustrative purposes only and are not included in the home.
Ownership History
Purchase Details
Purchase Details
Home Financials for this Owner
Home Financials are based on the most recent Mortgage that was taken out on this home.Purchase Details
Purchase Details
Home Financials for this Owner
Home Financials are based on the most recent Mortgage that was taken out on this home.Home Values in the Area
Average Home Value in this Area
Purchase History
| Date | Buyer | Sale Price | Title Company |
|---|---|---|---|
| Freo Florida Llc | $85,500 | Attorney | |
| Mena Jose | $175,500 | Fidelity Natl Title Ins Co | |
| Whipple Greg L | $126,000 | Lawyers Title Insurance Corp | |
| Williams La Tonya | $106,000 | Kb Title Services Inc |
Mortgage History
| Date | Status | Borrower | Loan Amount |
|---|---|---|---|
| Previous Owner | Mena Jose | $179,273 | |
| Previous Owner | Williams La Tonya | $105,089 |
Property History
| Date | Event | Price | List to Sale | Price per Sq Ft |
|---|---|---|---|---|
| 02/28/2026 02/28/26 | Off Market | $1,970 | -- | -- |
| 02/19/2026 02/19/26 | Price Changed | $1,970 | +1.3% | $2 / Sq Ft |
| 02/15/2026 02/15/26 | Price Changed | $1,945 | +0.3% | $2 / Sq Ft |
| 02/10/2026 02/10/26 | Price Changed | $1,940 | -2.5% | $2 / Sq Ft |
| 02/07/2026 02/07/26 | Price Changed | $1,990 | +0.3% | $2 / Sq Ft |
| 02/06/2026 02/06/26 | Price Changed | $1,985 | -0.8% | $2 / Sq Ft |
| 02/02/2026 02/02/26 | Price Changed | $2,000 | +0.3% | $2 / Sq Ft |
| 01/28/2026 01/28/26 | Price Changed | $1,995 | -3.2% | $2 / Sq Ft |
| 01/27/2026 01/27/26 | Price Changed | $2,060 | +0.2% | $2 / Sq Ft |
| 01/25/2026 01/25/26 | Price Changed | $2,055 | +0.2% | $2 / Sq Ft |
| 01/22/2026 01/22/26 | Price Changed | $2,050 | +0.2% | $2 / Sq Ft |
| 01/20/2026 01/20/26 | Price Changed | $2,045 | +1.5% | $2 / Sq Ft |
| 01/19/2026 01/19/26 | Price Changed | $2,015 | +1.3% | $2 / Sq Ft |
| 01/18/2026 01/18/26 | Price Changed | $1,990 | +1.8% | $2 / Sq Ft |
| 01/13/2026 01/13/26 | Price Changed | $1,955 | -1.3% | $2 / Sq Ft |
| 01/11/2026 01/11/26 | Price Changed | $1,980 | -0.8% | $2 / Sq Ft |
| 01/08/2026 01/08/26 | Price Changed | $1,995 | +0.3% | $2 / Sq Ft |
| 01/07/2026 01/07/26 | Price Changed | $1,990 | -1.0% | $2 / Sq Ft |
| 01/07/2026 01/07/26 | Price Changed | $2,010 | +0.2% | $2 / Sq Ft |
| 01/03/2026 01/03/26 | Price Changed | $2,005 | -2.4% | $2 / Sq Ft |
| 01/02/2026 01/02/26 | Price Changed | $2,055 | -1.4% | $2 / Sq Ft |
| 12/17/2025 12/17/25 | Price Changed | $2,085 | -0.7% | $2 / Sq Ft |
| 12/16/2025 12/16/25 | Price Changed | $2,100 | -0.2% | $2 / Sq Ft |
| 12/07/2025 12/07/25 | Price Changed | $2,105 | +1.4% | $2 / Sq Ft |
| 12/05/2025 12/05/25 | Price Changed | $2,075 | +2.0% | $2 / Sq Ft |
| 12/04/2025 12/04/25 | Price Changed | $2,035 | -0.2% | $2 / Sq Ft |
| 12/02/2025 12/02/25 | Price Changed | $2,040 | -0.2% | $2 / Sq Ft |
| 12/01/2025 12/01/25 | Price Changed | $2,045 | +1.5% | $2 / Sq Ft |
| 11/30/2025 11/30/25 | Price Changed | $2,015 | +6.9% | $2 / Sq Ft |
| 11/24/2025 11/24/25 | Price Changed | $1,885 | -0.3% | $2 / Sq Ft |
| 11/22/2025 11/22/25 | Price Changed | $1,890 | -0.3% | $2 / Sq Ft |
| 11/19/2025 11/19/25 | Price Changed | $1,895 | -0.3% | $2 / Sq Ft |
| 11/15/2025 11/15/25 | Price Changed | $1,900 | -0.3% | $2 / Sq Ft |
| 11/10/2025 11/10/25 | Price Changed | $1,905 | +1.1% | $2 / Sq Ft |
| 11/01/2025 11/01/25 | Price Changed | $1,885 | -2.1% | $2 / Sq Ft |
| 10/08/2025 10/08/25 | Price Changed | $1,925 | 0.0% | $2 / Sq Ft |
| 10/08/2025 10/08/25 | For Rent | $1,925 | +1.0% | -- |
| 11/15/2024 11/15/24 | Off Market | $1,905 | -- | -- |
| 11/10/2024 11/10/24 | Price Changed | $1,905 | -0.5% | $2 / Sq Ft |
| 11/09/2024 11/09/24 | Price Changed | $1,915 | -0.3% | $2 / Sq Ft |
| 11/04/2024 11/04/24 | Price Changed | $1,920 | +0.3% | $2 / Sq Ft |
| 11/02/2024 11/02/24 | Price Changed | $1,915 | +0.3% | $2 / Sq Ft |
| 11/01/2024 11/01/24 | Price Changed | $1,910 | -0.5% | $2 / Sq Ft |
| 10/30/2024 10/30/24 | Price Changed | $1,920 | -4.7% | $2 / Sq Ft |
| 10/29/2024 10/29/24 | Price Changed | $2,015 | +0.2% | $2 / Sq Ft |
| 10/27/2024 10/27/24 | Price Changed | $2,010 | +0.5% | $2 / Sq Ft |
| 10/25/2024 10/25/24 | Price Changed | $2,000 | +1.0% | $2 / Sq Ft |
| 10/24/2024 10/24/24 | Price Changed | $1,980 | +2.9% | $2 / Sq Ft |
| 10/23/2024 10/23/24 | Price Changed | $1,925 | +2.4% | $2 / Sq Ft |
| 10/22/2024 10/22/24 | Price Changed | $1,880 | +1.1% | $2 / Sq Ft |
| 10/21/2024 10/21/24 | For Rent | $1,860 | 0.0% | -- |
| 10/21/2024 10/21/24 | Price Changed | $1,860 | -2.9% | $2 / Sq Ft |
| 10/19/2024 10/19/24 | Off Market | $1,915 | -- | -- |
| 10/14/2024 10/14/24 | Price Changed | $1,915 | +0.3% | $2 / Sq Ft |
| 10/13/2024 10/13/24 | Price Changed | $1,910 | -1.0% | $2 / Sq Ft |
| 10/10/2024 10/10/24 | Price Changed | $1,930 | -0.3% | $2 / Sq Ft |
| 10/09/2024 10/09/24 | Price Changed | $1,935 | -3.5% | $2 / Sq Ft |
| 10/08/2024 10/08/24 | Price Changed | $2,005 | -0.5% | $2 / Sq Ft |
| 10/05/2024 10/05/24 | Price Changed | $2,015 | -0.7% | $2 / Sq Ft |
| 10/03/2024 10/03/24 | Price Changed | $2,030 | -29.5% | $2 / Sq Ft |
| 10/03/2024 10/03/24 | For Rent | $2,880 | +41.5% | -- |
| 10/02/2024 10/02/24 | Price Changed | $2,035 | -3.6% | $2 / Sq Ft |
| 10/01/2024 10/01/24 | Price Changed | $2,110 | -0.5% | $2 / Sq Ft |
| 09/25/2024 09/25/24 | Price Changed | $2,120 | -1.4% | $2 / Sq Ft |
| 09/23/2024 09/23/24 | Price Changed | $2,150 | -0.2% | $2 / Sq Ft |
| 09/22/2024 09/22/24 | Price Changed | $2,155 | -0.2% | $2 / Sq Ft |
| 09/21/2024 09/21/24 | Price Changed | $2,160 | -0.2% | $2 / Sq Ft |
| 09/20/2024 09/20/24 | Price Changed | $2,165 | -- | $2 / Sq Ft |
Tax History
| Year | Tax Paid | Tax Assessment Tax Assessment Total Assessment is a certain percentage of the fair market value that is determined by local assessors to be the total taxable value of land and additions on the property. | Land | Improvement |
|---|---|---|---|---|
| 2025 | $3,867 | $214,144 | $59,920 | $154,224 |
| 2024 | $3,867 | $216,025 | $59,920 | $156,105 |
| 2023 | $3,596 | $207,502 | $55,640 | $151,862 |
| 2022 | $3,530 | $182,640 | $51,360 | $131,280 |
| 2021 | $3,174 | $138,044 | $36,380 | $101,664 |
| 2020 | $2,931 | $129,509 | $34,240 | $95,269 |
| 2019 | $2,721 | $122,378 | $29,960 | $92,418 |
| 2018 | $2,550 | $115,062 | $0 | $0 |
| 2017 | $2,388 | $104,650 | $0 | $0 |
| 2016 | $2,163 | $83,499 | $0 | $0 |
| 2015 | $2,178 | $82,673 | $0 | $0 |
| 2014 | $2,082 | $78,130 | $0 | $0 |
| 2013 | -- | $68,215 | $0 | $0 |
Map
- 11813 Prickly Pear Way Unit 2
- 11646 Mango Ridge Blvd
- 5207 Peach Ave
- 5341 Coldpine Place
- 5343 Coldpine Place
- 11765 Blackbrook Ct
- 11767 Blackbrook Ct
- 5347 Coldpine Place
- 11763 Blackbrook Ct
- 11769 Blackbrook Ct
- 5349 Coldpine Place
- 5226 Lime Ave
- 11788 Blackbrook Ct
- 11786 Blackbrook Ct
- 5209 Lime Ave
- 0 Lime Ave
- 5230 Cherry Ave
- 5232 Pine St
- 4906 Presidential St
- 5320 Cherry Ave
- 11720 Court
- 11720 Mango Cross Ct
- 11724 Mango Cross Ct
- 11718 Mango Cross Ct
- 11736 Mango Cross Ct
- 11736 Mango Cross Ct Unit 1
- 11754 Mango Cross Ct Unit 2
- 11756 Mango Cross Ct
- 11752 Mango Cross Ct
- 11716 Mango Cross Ct
- 11758 Mango Cross Ct
- 11750 Mango Cross Ct
- 11723 Mango Cross Ct
- 11721 Mango Cross Ct Unit 1
- 11760 Mango Cross Ct
- 11714 Mango Cross Ct
- 11725 Mango Cross Ct
- 11719 Mango Cross Ct
- 11727 Mango Cross Ct
- 11715 Mango Cross Ct
Ask me questions while you tour the home.