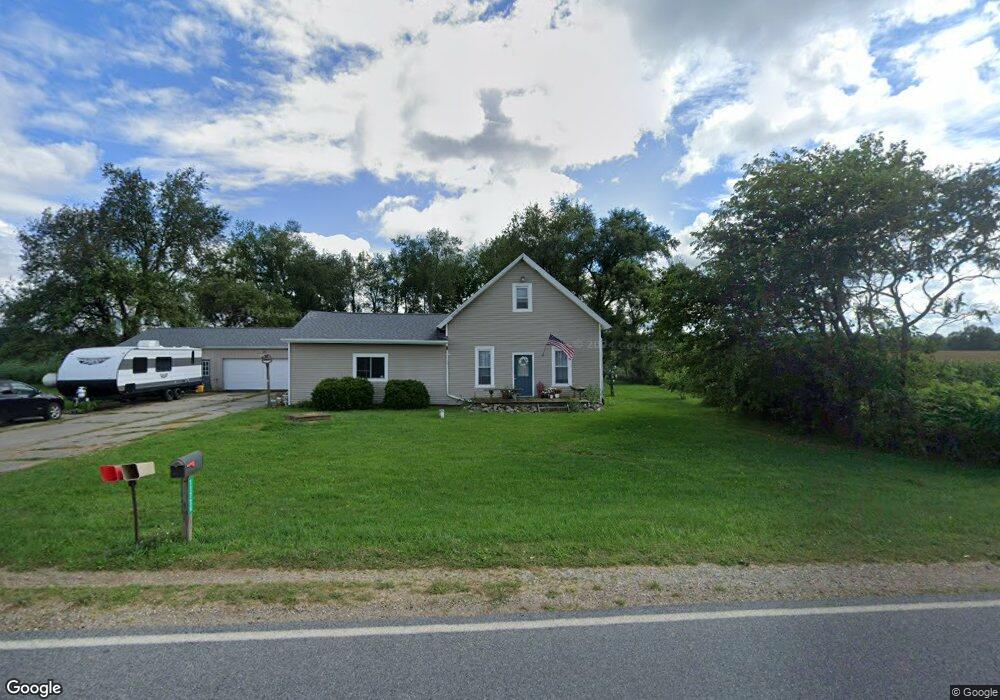
11726 B Dr S Ceresco, MI 49033
Estimated Value: $225,422 - $341,000
2
Beds
2
Baths
2,106
Sq Ft
$130/Sq Ft
Est. Value
About This Home
This home is located at 11726 B Dr S, Ceresco, MI 49033 and is currently estimated at $273,856, approximately $130 per square foot. 11726 B Dr S is a home located in Calhoun County with nearby schools including Harper Creek Middle School and Harper Creek High School.
Ownership History
Date
Name
Owned For
Owner Type
Purchase Details
Closed on
May 6, 2025
Sold by
Nowlin Barry M and Nowlin Mary
Bought by
Nowlin Barry M and Nowlin Mary
Current Estimated Value
Purchase Details
Closed on
Dec 10, 2004
Sold by
Rowles Daniel T and Rowles Faith L
Bought by
Nowlin Barry M and Nowlin Mary
Home Financials for this Owner
Home Financials are based on the most recent Mortgage that was taken out on this home.
Original Mortgage
$147,155
Interest Rate
5.77%
Mortgage Type
Purchase Money Mortgage
Purchase Details
Closed on
Aug 30, 2002
Sold by
Cameron Scott L and Kever Brooke M
Bought by
Rowles Daniel and Rowles Faith
Purchase Details
Closed on
Nov 27, 2000
Sold by
Carosella Tim and Carosella Kathryn
Bought by
Cameron Scott L and Kever Brooke M
Purchase Details
Closed on
Oct 27, 1993
Sold by
Drallette David and Drallette Sara
Bought by
Carosella Timothy and Carosella Kathryn
Create a Home Valuation Report for This Property
The Home Valuation Report is an in-depth analysis detailing your home's value as well as a comparison with similar homes in the area
Purchase History
| Date | Buyer | Sale Price | Title Company |
|---|---|---|---|
| Nowlin Barry M | -- | None Listed On Document | |
| Nowlin Barry M | -- | None Listed On Document | |
| Nowlin Barry M | $154,900 | Chicago Title Of Michigan | |
| Rowles Daniel | $129,500 | -- | |
| Cameron Scott L | $122,500 | -- | |
| Carosella Timothy | $75,000 | -- |
Source: Public Records
Mortgage History
| Date | Status | Borrower | Loan Amount |
|---|---|---|---|
| Previous Owner | Nowlin Barry M | $147,155 |
Source: Public Records
Tax History
| Year | Tax Paid | Tax Assessment Tax Assessment Total Assessment is a certain percentage of the fair market value that is determined by local assessors to be the total taxable value of land and additions on the property. | Land | Improvement |
|---|---|---|---|---|
| 2025 | $2,796 | $100,400 | $0 | $0 |
| 2024 | $1,702 | $98,700 | $0 | $0 |
| 2023 | $2,247 | $89,600 | $0 | $0 |
| 2022 | $2,247 | $86,100 | $0 | $0 |
| 2021 | $2,257 | $79,600 | $0 | $0 |
| 2020 | $2,217 | $72,600 | $0 | $0 |
| 2019 | $0 | $70,300 | $0 | $0 |
| 2018 | $0 | $66,900 | $8,800 | $58,100 |
| 2017 | $0 | $68,700 | $0 | $0 |
| 2016 | $0 | $66,100 | $0 | $0 |
| 2015 | -- | $66,000 | $16,375 | $49,625 |
| 2014 | -- | $65,800 | $16,375 | $49,425 |
Source: Public Records
Map
Nearby Homes
- 11506 11 Mile Rd
- 10660 D Dr S
- 11445 F Dr S
- 275 Battle Creek St
- 11754 E Dr N
- 11253 Wildwood Dr
- 14880 C Dr S
- 0 15 1 2 Mile Rd Unit 25024661
- 9304 I Dr S
- V/L Cedar Lake
- 15143 H Dr S
- 216 Winston Dr
- 218 Winston Dr
- 15627 13 Mile Rd
- 1375 Woodland Beach
- 13028 Harper Crossing
- 213 Wattles Rd S
- 111 S Fountain St
- VL Beadle Lake Rd
- 119 Greenfield Blvd
Your Personal Tour Guide
Ask me questions while you tour the home.