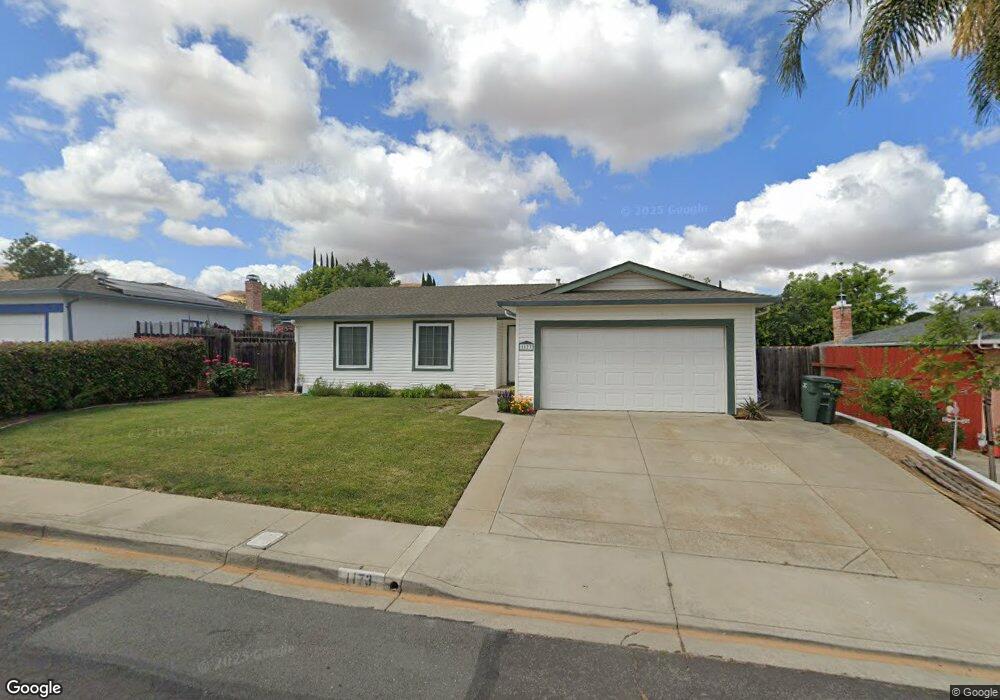
1173 Jensen Cir Pittsburg, CA 94565
East Contra Costa NeighborhoodEstimated Value: $463,618 - $521,000
3
Beds
1
Bath
986
Sq Ft
$512/Sq Ft
Est. Value
About This Home
This home is located at 1173 Jensen Cir, Pittsburg, CA 94565 and is currently estimated at $504,655, approximately $511 per square foot. 1173 Jensen Cir is a home located in Contra Costa County with nearby schools including Foothill Elementary School, Hillview Junior High School, and Pittsburg Senior High School.
Ownership History
Date
Name
Owned For
Owner Type
Purchase Details
Closed on
Sep 11, 2008
Sold by
Washington Mutual Bank
Bought by
Frank Lisa
Current Estimated Value
Home Financials for this Owner
Home Financials are based on the most recent Mortgage that was taken out on this home.
Original Mortgage
$127,920
Outstanding Balance
$85,044
Interest Rate
6.51%
Mortgage Type
Purchase Money Mortgage
Estimated Equity
$419,611
Purchase Details
Closed on
Feb 6, 2008
Sold by
Amoah Jacob A
Bought by
Washington Mutual Bank
Purchase Details
Closed on
Feb 22, 2006
Sold by
Crabtree Samuel E and Wilson Susan Lynne
Bought by
Amoah Jacob A
Home Financials for this Owner
Home Financials are based on the most recent Mortgage that was taken out on this home.
Original Mortgage
$348,000
Interest Rate
8%
Mortgage Type
Fannie Mae Freddie Mac
Purchase Details
Closed on
Jan 30, 2006
Sold by
Amoah Regina K
Bought by
Amoah Jacob
Home Financials for this Owner
Home Financials are based on the most recent Mortgage that was taken out on this home.
Original Mortgage
$348,000
Interest Rate
8%
Mortgage Type
Fannie Mae Freddie Mac
Purchase Details
Closed on
Oct 6, 2005
Sold by
Crabtree Samuel E
Bought by
Crabtree Samuel E and Wilson Susan Lynne
Create a Home Valuation Report for This Property
The Home Valuation Report is an in-depth analysis detailing your home's value as well as a comparison with similar homes in the area
Home Values in the Area
Average Home Value in this Area
Purchase History
| Date | Buyer | Sale Price | Title Company |
|---|---|---|---|
| Frank Lisa | $160,000 | Chicago Title Company | |
| Washington Mutual Bank | $220,500 | Service Link | |
| Amoah Jacob A | $435,000 | Commonwealth Land Title | |
| Amoah Jacob | -- | Commonwealth Land Title Co | |
| Crabtree Samuel E | -- | -- |
Source: Public Records
Mortgage History
| Date | Status | Borrower | Loan Amount |
|---|---|---|---|
| Open | Frank Lisa | $127,920 | |
| Previous Owner | Amoah Jacob A | $348,000 |
Source: Public Records
Tax History
| Year | Tax Paid | Tax Assessment Tax Assessment Total Assessment is a certain percentage of the fair market value that is determined by local assessors to be the total taxable value of land and additions on the property. | Land | Improvement |
|---|---|---|---|---|
| 2025 | $2,968 | $205,894 | $70,817 | $135,077 |
| 2024 | $2,880 | $201,858 | $69,429 | $132,429 |
| 2023 | $2,880 | $197,901 | $68,068 | $129,833 |
| 2022 | $2,913 | $194,022 | $66,734 | $127,288 |
| 2021 | $2,901 | $190,219 | $65,426 | $124,793 |
| 2019 | $2,756 | $184,580 | $63,487 | $121,093 |
| 2018 | $2,652 | $180,962 | $62,243 | $118,719 |
| 2017 | $2,624 | $177,415 | $61,023 | $116,392 |
| 2016 | $2,415 | $173,937 | $59,827 | $114,110 |
| 2015 | $2,537 | $171,325 | $58,929 | $112,396 |
| 2014 | $2,454 | $167,970 | $57,775 | $110,195 |
Source: Public Records
Map
Nearby Homes
- 1125 Jensen Dr
- 4350 Palo Verde Dr
- 1248 Metten Ave
- 4225 Mcfaul Dr
- 4221 Mcdermott Dr
- 4044 Granada Dr
- 27 Barrie Dr
- 808 Ventura Dr
- 61 Meadowbrook Cir
- 4337 Scenic Ave
- 1169 Park West Dr
- 16 Surf Dr
- 77 Hilo Dr
- 4320 Hillview Dr
- 4284 Hillview Dr
- 268 Coral Dr
- 1426 Cobblestone Dr
- 141 Maui Dr
- 4068 Barn Hollow Way
- 1602 Ashwood Dr
- 1157 Jensen Cir
- 1189 Jensen Cir
- 929 Jensen Cir
- 945 Jensen Cir
- 1141 Jensen Cir
- 911 Jensen Cir
- 959 Jensen Cir
- 1180 Jensen Cir
- 1146 Jensen Cir
- 971 Jensen Cir
- 1133 Jensen Cir
- 1077 Jensen Dr
- 1138 Jensen Cir
- 934 Jensen Cir
- 4302 San Miguel Cir
- 948 Jensen Cir
- 4306 San Miguel Cir
- 1255 Gloria Dr
- 983 Jensen Cir
- 920 Jensen Cir
Your Personal Tour Guide
Ask me questions while you tour the home.