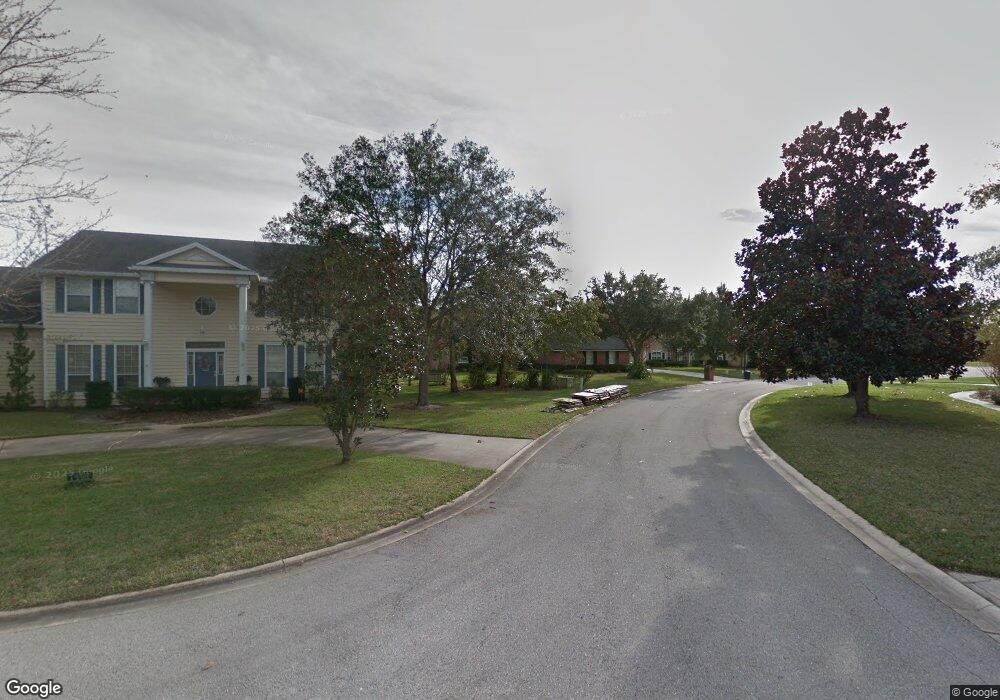
1173 N Hideaway Jacksonville, FL
Estimated Value: $588,534 - $706,000
4
Beds
4
Baths
2,687
Sq Ft
$235/Sq Ft
Est. Value
About This Home
This home is located at 1173 N Hideaway, Jacksonville, FL and is currently estimated at $630,384, approximately $234 per square foot. 1173 N Hideaway is a home located in St. Johns County with nearby schools including Cunningham Creek Elementary School, Switzerland Point Middle School, and Bartram Trail High School.
Ownership History
Date
Name
Owned For
Owner Type
Purchase Details
Closed on
Feb 14, 2019
Sold by
Blair Valerie
Bought by
Hannon Steven and Hannon Mary
Current Estimated Value
Home Financials for this Owner
Home Financials are based on the most recent Mortgage that was taken out on this home.
Original Mortgage
$356,250
Outstanding Balance
$313,208
Interest Rate
4.5%
Mortgage Type
New Conventional
Estimated Equity
$317,176
Purchase Details
Closed on
Jan 23, 2003
Sold by
Blair Michael
Bought by
Blair Valerie
Home Financials for this Owner
Home Financials are based on the most recent Mortgage that was taken out on this home.
Original Mortgage
$235,000
Interest Rate
3%
Mortgage Type
Balloon
Purchase Details
Closed on
Mar 9, 2001
Sold by
Providence Construction Company
Bought by
Blair Michael and Blair Valerie
Home Financials for this Owner
Home Financials are based on the most recent Mortgage that was taken out on this home.
Original Mortgage
$221,245
Interest Rate
7.09%
Create a Home Valuation Report for This Property
The Home Valuation Report is an in-depth analysis detailing your home's value as well as a comparison with similar homes in the area
Home Values in the Area
Average Home Value in this Area
Purchase History
| Date | Buyer | Sale Price | Title Company |
|---|---|---|---|
| Hannon Steven | $375,000 | Attorney | |
| Blair Valerie | -- | -- | |
| Blair Michael | $232,900 | -- |
Source: Public Records
Mortgage History
| Date | Status | Borrower | Loan Amount |
|---|---|---|---|
| Open | Hannon Steven | $356,250 | |
| Previous Owner | Blair Valerie | $235,000 | |
| Previous Owner | Blair Michael | $221,245 |
Source: Public Records
Tax History
| Year | Tax Paid | Tax Assessment Tax Assessment Total Assessment is a certain percentage of the fair market value that is determined by local assessors to be the total taxable value of land and additions on the property. | Land | Improvement |
|---|---|---|---|---|
| 2025 | $3,274 | $293,865 | -- | -- |
| 2024 | $3,274 | $285,583 | -- | -- |
| 2023 | $3,274 | $277,265 | $0 | $0 |
| 2022 | $3,178 | $269,189 | $0 | $0 |
| 2021 | $3,156 | $261,349 | $0 | $0 |
| 2020 | $3,130 | $256,605 | $0 | $0 |
| 2019 | $4,305 | $291,958 | $0 | $0 |
| 2018 | $4,089 | $273,805 | $0 | $0 |
| 2017 | $4,018 | $263,603 | $45,500 | $218,103 |
| 2016 | $4,083 | $263,603 | $0 | $0 |
| 2015 | $3,760 | $234,341 | $0 | $0 |
| 2014 | $3,680 | $224,141 | $0 | $0 |
Source: Public Records
Map
Nearby Homes
- 1304 Hideaway Dr S
- 237 Twining Trace
- 316 Talwood Terrace
- 1220 Creek Bend Rd
- 623 Hampton Downs Ct
- 1217 N Burgandy Trail
- 1463 Mallard Landing Blvd
- 1224 N Burgandy Trail
- 256 Village Green Ave
- 276 Village Green Ave
- 436 Chattan Way
- 1977 Falcon Ct
- 241 N Aberdeenshire Dr
- 233 N Aberdeenshire Dr
- 1958 Hawkcrest Dr
- 148 Village Green Ave
- 209 N Checkerberry Way
- 117 Morayshire Ct
- 345 Oakmoss Dr
- 34 Arrowwood Dr
- 1173 Hideaway Dr N
- 1169 Hideaway Dr N
- 1177 Hideaway Dr N
- 1172 Hideaway Dr N
- 1181 Hideaway Dr N
- 1165 Hideaway Dr N
- 632 Catherine Foster Ln
- 1190 Hideaway Dr N
- 1164 Hideaway Dr N
- 636 Catherine Foster Ln
- 1185 Hideaway Dr N
- 628 Catherine Foster Ln
- 1161 Hideaway Dr N
- 1198 Hideaway Dr N
- 1160 Hideaway Dr N
- 721 Muskogee Ln
- 624 Catherine Foster Ln
- 637 Catherine Foster Ln
- 1157 Hideaway Dr N
- 1202 Hideaway Dr N
Your Personal Tour Guide
Ask me questions while you tour the home.