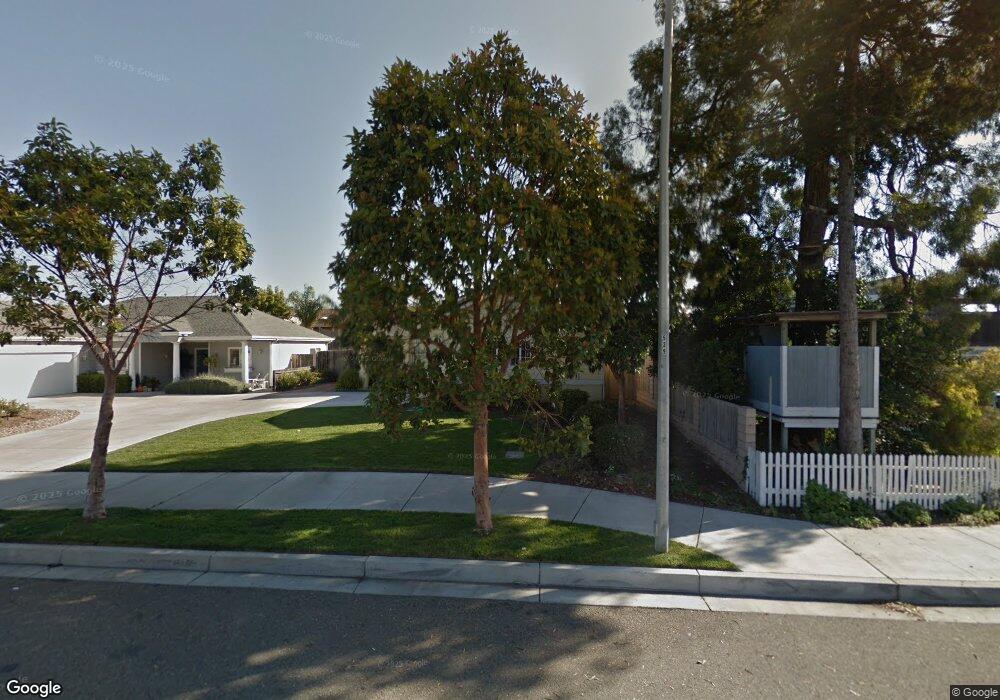
1173 S 16th St Unit LT37 Grover Beach, CA 93433
Estimated Value: $758,164 - $911,000
3
Beds
2
Baths
1,498
Sq Ft
$572/Sq Ft
Est. Value
About This Home
This home is located at 1173 S 16th St Unit LT37, Grover Beach, CA 93433 and is currently estimated at $856,541, approximately $571 per square foot. 1173 S 16th St Unit LT37 is a home located in San Luis Obispo County with nearby schools including Grover Beach Elementary School, Paulding Middle School, and Arroyo Grande High School.
Ownership History
Date
Name
Owned For
Owner Type
Purchase Details
Closed on
Jun 29, 2017
Sold by
Davidson Mary S and Davidson Mary
Bought by
Davidson Mary S and The Mary S Davidson Revocable
Current Estimated Value
Purchase Details
Closed on
Jun 12, 2013
Sold by
U S Bank National Association
Bought by
Davidson Mary
Purchase Details
Closed on
Apr 12, 2013
Sold by
Zucker David S and Zucker Jacqueline E
Bought by
U S Bank National Association
Purchase Details
Closed on
Dec 16, 2003
Sold by
La Serena Llc
Bought by
Zucker David S and Zucker Jacqueline E
Home Financials for this Owner
Home Financials are based on the most recent Mortgage that was taken out on this home.
Original Mortgage
$323,920
Interest Rate
5.75%
Mortgage Type
New Conventional
Create a Home Valuation Report for This Property
The Home Valuation Report is an in-depth analysis detailing your home's value as well as a comparison with similar homes in the area
Home Values in the Area
Average Home Value in this Area
Purchase History
| Date | Buyer | Sale Price | Title Company |
|---|---|---|---|
| Davidson Mary S | -- | None Available | |
| Davidson Mary | $390,000 | Fatco | |
| U S Bank National Association | $498,284 | None Available | |
| Zucker David S | $405,000 | Fidelity Title Company |
Source: Public Records
Mortgage History
| Date | Status | Borrower | Loan Amount |
|---|---|---|---|
| Previous Owner | Zucker David S | $323,920 | |
| Closed | Zucker David S | $80,980 |
Source: Public Records
Tax History Compared to Growth
Tax History
| Year | Tax Paid | Tax Assessment Tax Assessment Total Assessment is a certain percentage of the fair market value that is determined by local assessors to be the total taxable value of land and additions on the property. | Land | Improvement |
|---|---|---|---|---|
| 2025 | $5,312 | $480,244 | $277,065 | $203,179 |
| 2024 | $5,268 | $470,829 | $271,633 | $199,196 |
| 2023 | $5,268 | $461,598 | $266,307 | $195,291 |
| 2022 | $5,267 | $452,548 | $261,086 | $191,462 |
| 2021 | $5,204 | $443,675 | $255,967 | $187,708 |
| 2020 | $5,145 | $439,127 | $253,343 | $185,784 |
| 2019 | $5,104 | $430,518 | $248,376 | $182,142 |
| 2018 | $5,040 | $422,077 | $243,506 | $178,571 |
| 2017 | $4,816 | $413,802 | $238,732 | $175,070 |
| 2016 | $4,411 | $405,689 | $234,051 | $171,638 |
| 2015 | $4,310 | $399,596 | $230,536 | $169,060 |
| 2014 | $4,133 | $391,770 | $226,021 | $165,749 |
Source: Public Records
Map
Nearby Homes
- 1207 Capitola St
- 1206 Capitola St
- 155 Lynne St
- 1180 Marbella Ct
- 1626 Monterey Ave
- 1338 16th St
- 1211 Baden Ave
- 943 Huston St
- 1084 Baden Ave
- 425 Bakeman Ln
- 948 Huston St
- 1610 16th St
- 1024 Baden Ave
- 1241 Farroll Ave Unit 58
- 2201 La Verne St
- 1659 Paso Robles St
- 978 Griffin St
- 1707 Seabright Ave
- 1681 Ocean St
- 560 S 12th St
- 1211 S 16th St
- 1161 S 16th St Unit 38
- 1161 S 16th St
- 1215 S 16th St
- 1170 S 16th St Unit LT36
- 1208 S 16th St
- 1168 S 16th St Unit LT35
- 1168 S 16th St
- 1212 S 16th St
- 1157 S 16th St Unit 39
- 1157 S 16th St
- 1219 S 16th St
- 1214 S 16th St
- 1162 Loreto Ct Unit LT52
- 1162 Loreto Ct
- 1178 Loreto Ct Unit LT53
- 1178 Loreto Ct
- 1156 S 16th St Unit LT.