Estimated Value: $128,000 - $173,000
2
Beds
1
Bath
982
Sq Ft
$147/Sq Ft
Est. Value
About This Home
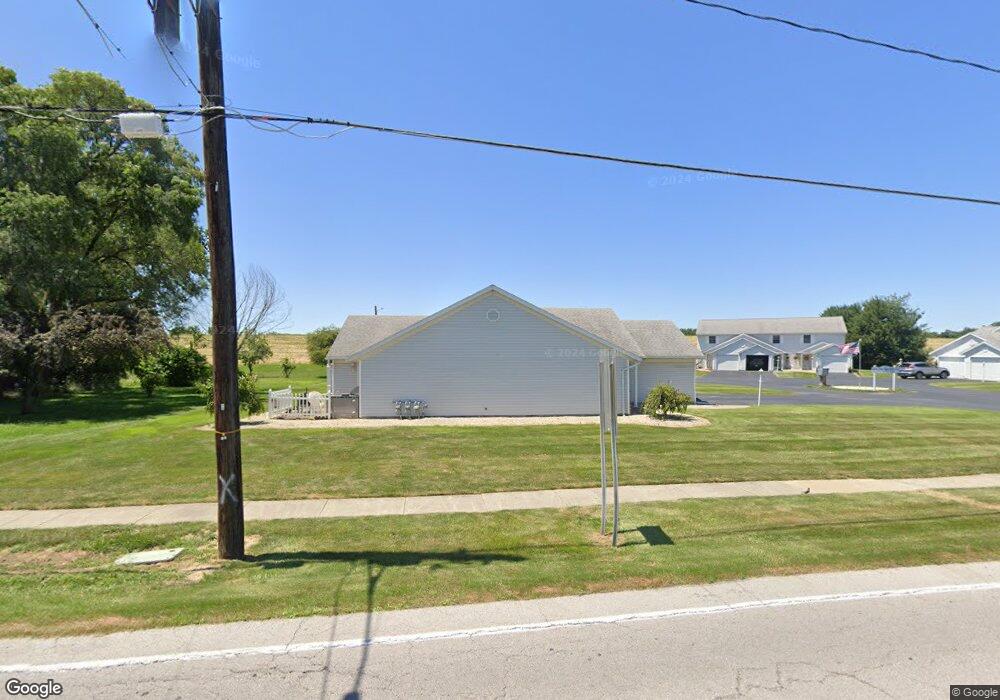
This home is located at 1173 S Main St Unit 401, Clyde, OH 43410 and is currently estimated at $144,110, approximately $146 per square foot. 1173 S Main St Unit 401 is a home located in Sandusky County with nearby schools including Clyde High School, Harvest Temple Christian Academy, and St. Mary's School.
Ownership History
Date
Name
Owned For
Owner Type
Purchase Details
Closed on
Jun 15, 2011
Sold by
May Christine I
Bought by
G M E Dilute Llc
Current Estimated Value
Purchase Details
Closed on
Aug 5, 2005
Sold by
Farrar Carolyn S and Farrar Richard G
Bought by
May Christine I
Home Financials for this Owner
Home Financials are based on the most recent Mortgage that was taken out on this home.
Original Mortgage
$76,500
Interest Rate
5.71%
Mortgage Type
Purchase Money Mortgage
Purchase Details
Closed on
Nov 29, 2000
Sold by
Geiman John I
Bought by
Farrar Carolyn S
Home Financials for this Owner
Home Financials are based on the most recent Mortgage that was taken out on this home.
Original Mortgage
$58,400
Interest Rate
7.86%
Mortgage Type
New Conventional
Purchase Details
Closed on
Aug 1, 1992
Bought by
G.M.E. Dilute Llc
Create a Home Valuation Report for This Property
The Home Valuation Report is an in-depth analysis detailing your home's value as well as a comparison with similar homes in the area
Home Values in the Area
Average Home Value in this Area
Purchase History
| Date | Buyer | Sale Price | Title Company |
|---|---|---|---|
| G M E Dilute Llc | $68,500 | First American | |
| May Christine I | $63,750 | -- | |
| Farrar Carolyn S | $73,000 | -- | |
| G.M.E. Dilute Llc | $50,000 | -- |
Source: Public Records
Mortgage History
| Date | Status | Borrower | Loan Amount |
|---|---|---|---|
| Previous Owner | May Christine I | $76,500 | |
| Previous Owner | Farrar Carolyn S | $58,400 |
Source: Public Records
Tax History Compared to Growth
Tax History
| Year | Tax Paid | Tax Assessment Tax Assessment Total Assessment is a certain percentage of the fair market value that is determined by local assessors to be the total taxable value of land and additions on the property. | Land | Improvement |
|---|---|---|---|---|
| 2024 | $1,393 | $37,140 | $7,670 | $29,470 |
| 2023 | $1,393 | $25,980 | $5,360 | $20,620 |
| 2022 | $1,060 | $25,980 | $5,360 | $20,620 |
| 2021 | $1,072 | $25,980 | $5,360 | $20,620 |
| 2020 | $1,085 | $25,450 | $5,360 | $20,090 |
| 2019 | $1,072 | $25,450 | $5,360 | $20,090 |
| 2018 | $1,072 | $25,450 | $5,360 | $20,090 |
| 2017 | $1,022 | $23,630 | $5,360 | $18,270 |
| 2016 | $1,007 | $23,630 | $5,360 | $18,270 |
| 2015 | $995 | $23,630 | $5,360 | $18,270 |
| 2014 | $1,097 | $24,860 | $5,360 | $19,500 |
| 2013 | $1,073 | $24,860 | $5,360 | $19,500 |
Source: Public Records
Map
Nearby Homes
- 222 Bertha Ave
- 209 Fair St
- 315 E Grant St
- 628 W Maple St
- 230 S Main St
- 322 Vine St
- 235 W Buckeye St
- 167 Excalibur Dr
- 118 E Buckeye St
- 0 Merlin Ln Unit 20253762
- 0 Merlin Ln Unit 20253639
- 1337 E Sr 20
- 741 May St
- 0 Ames St
- 0 Durnwald Dr
- CR 260 89.6 acres Durnwald Dr
- 625 Ames St
- 535 Duane St
- 2114 S Main St
- 117 Nelson St
- 1173 S Main St Unit 403
- 1173 S Main St Unit 402
- 1173 S Main St Unit 303
- 1173 S Main St Unit 302
- 1173 S Main St Unit 301
- 1173 S Main St Unit 203
- 1173 S Main St Unit 202
- 1173 S Main St Unit 201
- 1173 S Main St Unit 103
- 1173 S Main St Unit 102
- 1173 S Main St Unit 101
- 1173 S Main St
- 1425 S Main St
- 1175 S Main St
- 1445 S Main St
- 1179 S Main St Unit 11
- 1 N St Rt 101
- 1185 S Main St
- 1463 S Main St
- 1195 S Main St