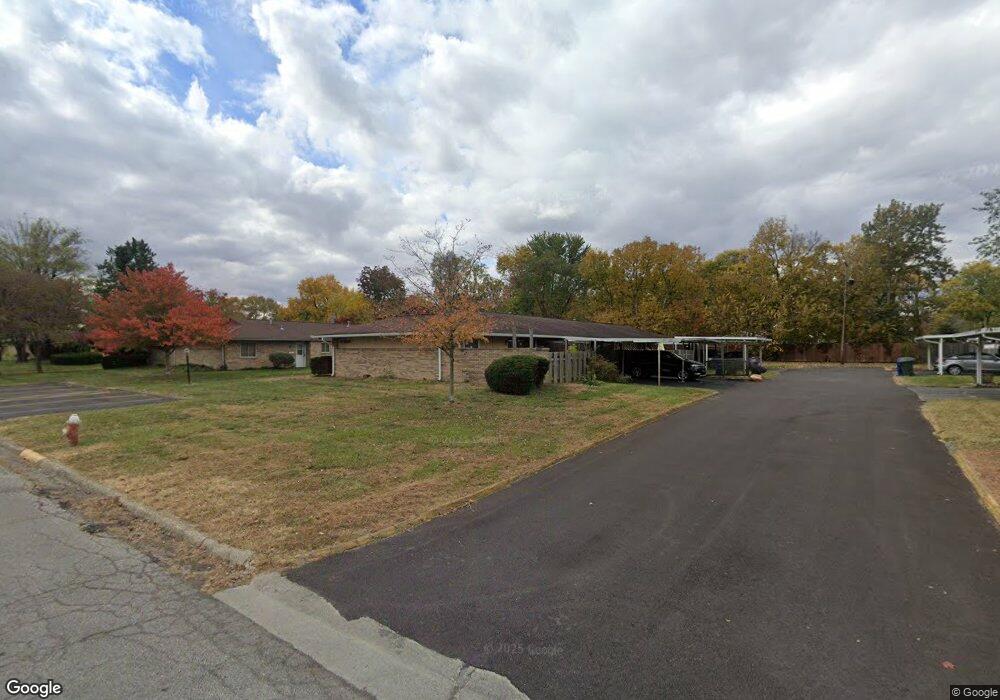
1173 Woodbrook Cir W Unit 55 Columbus, OH 43223
Brookshire NeighborhoodEstimated Value: $90,034 - $108,000
2
Beds
1
Bath
858
Sq Ft
$113/Sq Ft
Est. Value
About This Home
This home is located at 1173 Woodbrook Cir W Unit 55, Columbus, OH 43223 and is currently estimated at $97,259, approximately $113 per square foot. 1173 Woodbrook Cir W Unit 55 is a home located in Franklin County with nearby schools including Lindbergh Elementary School, Hilltonia Middle School, and Briggs High School.
Ownership History
Date
Name
Owned For
Owner Type
Purchase Details
Closed on
Jan 13, 2017
Sold by
Cremeans Stacie M
Bought by
Wroten Dixie
Current Estimated Value
Purchase Details
Closed on
Jul 22, 2010
Sold by
Olney Angelina L and Hartman James A
Bought by
Cremeans Stacie M
Purchase Details
Closed on
Jan 7, 2010
Sold by
Secretary Of Housing & Urban Development
Bought by
Olney Angelina L and Hartman James A
Purchase Details
Closed on
Feb 6, 2009
Sold by
Us Bank Na
Bought by
Secretary Of Housing & Urban Development
Purchase Details
Closed on
Jan 23, 2009
Sold by
Mullett Sharon K
Bought by
Us Bank Na
Purchase Details
Closed on
Mar 31, 1999
Sold by
Yunker Robert C
Bought by
Mullett Sharon K
Home Financials for this Owner
Home Financials are based on the most recent Mortgage that was taken out on this home.
Original Mortgage
$50,700
Interest Rate
6.89%
Mortgage Type
FHA
Purchase Details
Closed on
Jun 10, 1988
Bought by
Yunker Alta L
Create a Home Valuation Report for This Property
The Home Valuation Report is an in-depth analysis detailing your home's value as well as a comparison with similar homes in the area
Home Values in the Area
Average Home Value in this Area
Purchase History
| Date | Buyer | Sale Price | Title Company |
|---|---|---|---|
| Wroten Dixie | $44,000 | Great American Title | |
| Cremeans Stacie M | $23,500 | Stella | |
| Olney Angelina L | $17,666 | Lakeside Ti | |
| Secretary Of Housing & Urban Development | -- | None Available | |
| Us Bank Na | $28,000 | None Available | |
| Mullett Sharon K | $52,500 | Independent Title | |
| Yunker Alta L | $34,000 | -- |
Source: Public Records
Mortgage History
| Date | Status | Borrower | Loan Amount |
|---|---|---|---|
| Previous Owner | Mullett Sharon K | $50,700 |
Source: Public Records
Tax History Compared to Growth
Tax History
| Year | Tax Paid | Tax Assessment Tax Assessment Total Assessment is a certain percentage of the fair market value that is determined by local assessors to be the total taxable value of land and additions on the property. | Land | Improvement |
|---|---|---|---|---|
| 2024 | $811 | $27,860 | $5,250 | $22,610 |
| 2023 | $828 | $27,860 | $5,250 | $22,610 |
| 2022 | $403 | $16,520 | $1,540 | $14,980 |
| 2021 | $404 | $16,520 | $1,540 | $14,980 |
| 2020 | $404 | $16,520 | $1,540 | $14,980 |
| 2019 | $801 | $13,200 | $1,230 | $11,970 |
| 2018 | $662 | $13,200 | $1,230 | $11,970 |
| 2017 | $524 | $8,650 | $1,230 | $7,420 |
| 2016 | $578 | $8,720 | $1,300 | $7,420 |
| 2015 | $524 | $8,720 | $1,300 | $7,420 |
| 2014 | $526 | $8,720 | $1,300 | $7,420 |
| 2013 | $288 | $9,660 | $1,435 | $8,225 |
Source: Public Records
Map
Nearby Homes
- 1119 Hardesty Place E Unit 1
- 2336 Woodbrook Cir N Unit 92 B
- 1258 Woodbrook Cir W Unit 199
- 2382 Hardesty Dr S Unit Q-5
- 2436 Hardesty Dr S Unit 4
- 2337 Hardesty Ct Unit 1
- 1085 Hardesty Place E Unit 4
- 2322 Hardesty Ct Unit I11
- 2334 Hardesty Ct Unit 5
- 2547 Rosedale Ave
- 2367 Hardesty Dr N Unit 1-1
- 2180 Eakin Rd
- 2610 Spaatz Ave
- 0 S Central Ave
- 2491 Vanderberg Ave
- 2530 Vanderberg Ave
- 2538 Vanderberg Ave
- 2210 October Ridge Dr
- 2579 Eakin Rd
- 815 S Wayne Ave
- 1173 Woodbrook Cir W Unit 53
- 1173 Woodbrook Cir W
- 1173 Woodbrook Cir W Unit 56
- 1173 Woodbrook Cir W Unit B
- 1185 Woodbrook Cir W Unit 50
- 1185 Woodbrook Cir W
- 1185 Woodbrook Cir W
- 1185 Woodbrook Cir W Unit 52
- 1185 Woodbrook Cir W Unit B
- 1185 Woodbrook Cir W Unit A
- 1161 Woodbrook Cir W Unit A
- 1161 Woodbrook Cir W
- 1161 Woodbrook Cir W
- 1161 Woodbrook Cir W Unit 59
- 1161 Woodbrook Cir W Unit C
- 1161 Woodbrook Cir W Unit 57
- 1161 Woodbrook Cir W Unit B
- 1199 Woodbrook Cir W Unit 46
- 1199 Woodbrook Cir W
- 1199 Woodbrook Cir W