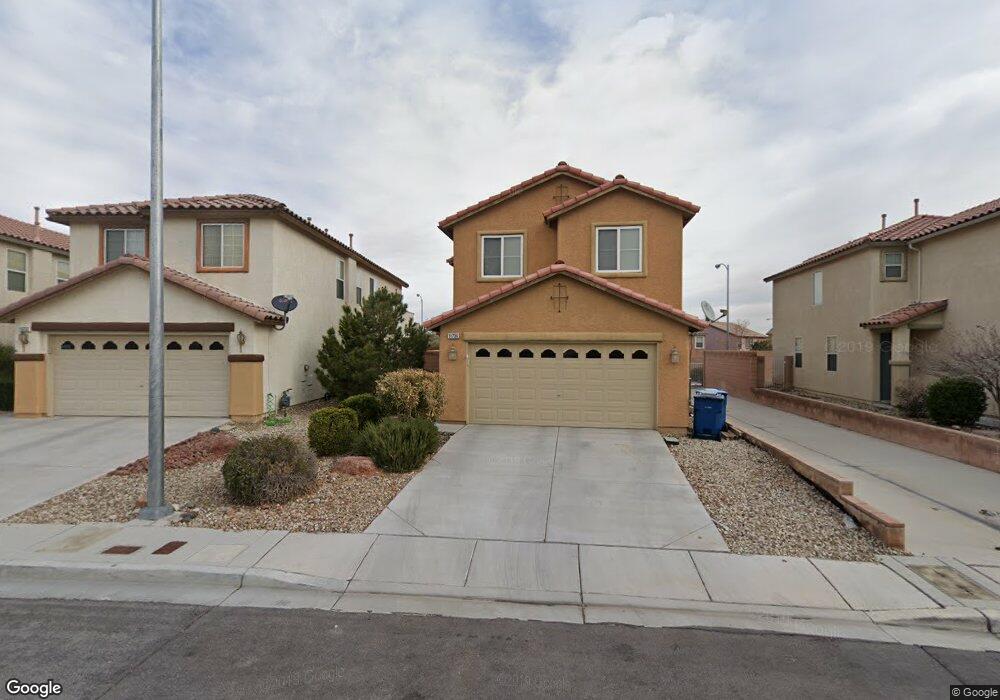
11736 Garland Grove Ln Las Vegas, NV 89183
Silverado Ranch NeighborhoodEstimated Value: $413,722 - $467,000
4
Beds
3
Baths
2,014
Sq Ft
$222/Sq Ft
Est. Value
About This Home
This home is located at 11736 Garland Grove Ln, Las Vegas, NV 89183 and is currently estimated at $447,931, approximately $222 per square foot. 11736 Garland Grove Ln is a home located in Clark County with nearby schools including Steve Schorr Elementary School, Del E. Webb Middle School, and Liberty High School.
Ownership History
Date
Name
Owned For
Owner Type
Purchase Details
Closed on
May 17, 2013
Sold by
Ahmavaara Kirsi and Ahmavaara Kalle
Bought by
Kivi Estates Llc
Current Estimated Value
Purchase Details
Closed on
Nov 28, 2012
Sold by
Ahmavaara Kirsi and Ahmavaara Kalle
Bought by
Ahmavaara Kalle and Ahmavaara Kirsi
Home Financials for this Owner
Home Financials are based on the most recent Mortgage that was taken out on this home.
Original Mortgage
$111,375
Interest Rate
3.33%
Mortgage Type
New Conventional
Purchase Details
Closed on
Sep 4, 2012
Sold by
Lai Tam and Tam Gary
Bought by
Ahmavaara Kirsi and Ahmavaara Kalle
Purchase Details
Closed on
Sep 15, 2011
Sold by
U S Bank National Association
Bought by
Lai Tam and Tam Gary
Purchase Details
Closed on
May 11, 2011
Sold by
Colin Araceli G
Bought by
U S Bank National Association
Purchase Details
Closed on
May 23, 2006
Sold by
Kb Home Nevada Inc
Bought by
Colin Araceli G
Home Financials for this Owner
Home Financials are based on the most recent Mortgage that was taken out on this home.
Original Mortgage
$297,514
Interest Rate
9.3%
Mortgage Type
Unknown
Create a Home Valuation Report for This Property
The Home Valuation Report is an in-depth analysis detailing your home's value as well as a comparison with similar homes in the area
Home Values in the Area
Average Home Value in this Area
Purchase History
| Date | Buyer | Sale Price | Title Company |
|---|---|---|---|
| Kivi Estates Llc | -- | None Available | |
| Ahmavaara Kalle | -- | Equity Title Of Nevada | |
| Ahmavaara Kirsi | $148,500 | Lawyers Title Of Nevada Hen | |
| Lai Tam | $133,000 | Servicelink Irvine | |
| U S Bank National Association | $112,500 | Fidelity Natl Title Ins Co | |
| Colin Araceli G | $330,572 | First Amer Title Co Of Nv |
Source: Public Records
Mortgage History
| Date | Status | Borrower | Loan Amount |
|---|---|---|---|
| Previous Owner | Ahmavaara Kalle | $111,375 | |
| Previous Owner | Colin Araceli G | $297,514 |
Source: Public Records
Tax History Compared to Growth
Tax History
| Year | Tax Paid | Tax Assessment Tax Assessment Total Assessment is a certain percentage of the fair market value that is determined by local assessors to be the total taxable value of land and additions on the property. | Land | Improvement |
|---|---|---|---|---|
| 2025 | $1,973 | $125,835 | $39,200 | $86,635 |
| 2024 | $1,916 | $125,835 | $39,200 | $86,635 |
| 2023 | $2,009 | $115,706 | $33,950 | $81,756 |
| 2022 | $1,860 | $102,099 | $27,650 | $74,449 |
| 2021 | $1,722 | $95,923 | $25,200 | $70,723 |
| 2020 | $1,597 | $95,257 | $25,200 | $70,057 |
| 2019 | $1,577 | $90,608 | $22,050 | $68,558 |
| 2018 | $1,522 | $83,161 | $17,500 | $65,661 |
| 2017 | $2,421 | $82,533 | $16,100 | $66,433 |
| 2016 | $1,426 | $71,062 | $12,950 | $58,112 |
| 2015 | $1,422 | $53,117 | $9,450 | $43,667 |
| 2014 | $1,378 | $45,587 | $5,250 | $40,337 |
Source: Public Records
Map
Nearby Homes
- 218 Lantana Breeze Dr
- 11819 Bella Luna St
- 11771 Bergamo Ct
- 11668 Tierney Creek Dr
- 11609 Andorra St
- 11769 Elianto St
- 11746 Magliana St
- 11862 Partenio Ct
- 11560 S Stivali St
- 11934 Wild Chamomile St
- 326 E Neal Ave
- 178 Elexese Ct
- 104 Masserta Ct
- 72 Dark Creek Ave
- 68 Jewel Mine Ave
- 69 Desert Palm Dr
- 11929 Haven St
- 57 Foxworth Ct
- 124 Nola Stream Ct
- 11376 Castor St
- 11732 Garland Grove Ln
- 11740 Garland Grove Ln
- 11740 Garland Grove Ln
- 11728 Garland Grove Ln
- 11744 Garland Grove Ln
- 11724 Garland Grove Ln
- 11748 Garland Grove Ln
- 11745 Garland Grove Ln
- 11720 Garland Grove Ln
- 11752 Garland Grove Ln
- 11736 Village Arbor St Unit 1
- 11742 Village Arbor St
- 245 Del Cira Ave
- 241 Del Cira Ave
- 237 Del Cira Ave
- 11716 Garland Grove Ln
- 235 Del Cira Ave
- 11748 Village Arbor St
- 233 Del Cira Ave
- 11756 Garland Grove Ln