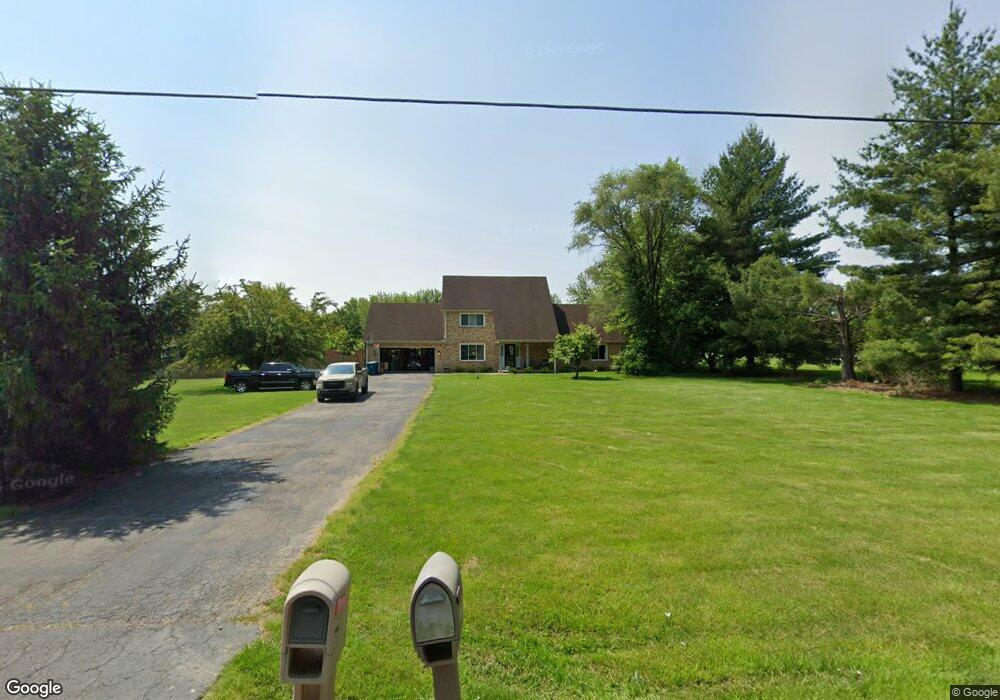
11739 S Mcgregor Rd Indianapolis, IN 46259
Estimated Value: $357,000 - $481,978
3
Beds
2
Baths
1,917
Sq Ft
$225/Sq Ft
Est. Value
About This Home
This home is located at 11739 S Mcgregor Rd, Indianapolis, IN 46259 and is currently estimated at $431,245, approximately $224 per square foot. 11739 S Mcgregor Rd is a home located in Marion County with nearby schools including Franklin Central High School.
Ownership History
Date
Name
Owned For
Owner Type
Purchase Details
Closed on
Sep 28, 2018
Sold by
Darlene Moore Keri
Bought by
Amanda Jones
Current Estimated Value
Home Financials for this Owner
Home Financials are based on the most recent Mortgage that was taken out on this home.
Original Mortgage
$243,000
Outstanding Balance
$211,910
Interest Rate
4.5%
Mortgage Type
New Conventional
Estimated Equity
$219,335
Purchase Details
Closed on
Sep 8, 2016
Sold by
Moore David Harrison
Bought by
Moore Keri Darlene
Purchase Details
Closed on
Feb 9, 2009
Sold by
Price Judith K and Moore Keri Darlene
Bought by
Moore Keri Darlene and Moore David Harrison
Purchase Details
Closed on
Feb 7, 2008
Sold by
Price Judith K
Bought by
Price Judith K and Moore Keri Darlene
Purchase Details
Closed on
Oct 12, 2007
Sold by
Brady Francis D and Brady Hilda M
Bought by
Price Judith K
Create a Home Valuation Report for This Property
The Home Valuation Report is an in-depth analysis detailing your home's value as well as a comparison with similar homes in the area
Home Values in the Area
Average Home Value in this Area
Purchase History
| Date | Buyer | Sale Price | Title Company |
|---|---|---|---|
| Amanda Jones | $270,000 | -- | |
| Jones Amanda | $270,000 | Title Alliance Of Indy Metro | |
| Moore Keri Darlene | -- | None Available | |
| Moore Keri Darlene | -- | None Available | |
| Price Judith K | -- | None Available | |
| Price Judith K | -- | None Available |
Source: Public Records
Mortgage History
| Date | Status | Borrower | Loan Amount |
|---|---|---|---|
| Open | Jones Amanda | $243,000 |
Source: Public Records
Tax History Compared to Growth
Tax History
| Year | Tax Paid | Tax Assessment Tax Assessment Total Assessment is a certain percentage of the fair market value that is determined by local assessors to be the total taxable value of land and additions on the property. | Land | Improvement |
|---|---|---|---|---|
| 2024 | $4,024 | $337,500 | $63,200 | $274,300 |
| 2023 | $4,024 | $337,400 | $63,100 | $274,300 |
| 2022 | $4,041 | $324,000 | $63,100 | $260,900 |
| 2021 | $3,926 | $313,900 | $63,100 | $250,800 |
| 2020 | $3,525 | $283,700 | $57,600 | $226,100 |
| 2019 | $3,359 | $266,000 | $52,600 | $213,400 |
| 2018 | $3,092 | $239,700 | $52,600 | $187,100 |
| 2017 | $5,281 | $243,400 | $52,600 | $190,800 |
| 2016 | $3,078 | $239,100 | $52,600 | $186,500 |
| 2014 | $2,645 | $217,200 | $40,100 | $177,100 |
| 2013 | $2,670 | $217,100 | $40,000 | $177,100 |
Source: Public Records
Map
Nearby Homes
- 8990 N 850 W
- 11331 Bloomfield Ct
- 11336 Bloomfield Ct
- 8211 Firefly Way
- 8148 Gathering Cir
- 5950 S Carroll Rd
- 11812 Southeastern Ave
- 11253 Maze Rd
- 10736 Crackling Dr
- 6531 Mossy Creek Ct
- N 850 W Fairland
- 11809 Maze Creek Dr
- 10605 Indian Creek Rd S
- 6026 Wilshire Dr
- 10417 Sand Mill Ln
- 10241 Arctic Edge Dr
- 10236 Arctic Edge Dr
- 10319 Little Island Dr
- 10151 Redwood Peak Ln
- 10139 Redwood Peak Ln
- 11739 E Mcgregor Rd
- 11733 E Mcgregor Rd
- 11733 S Mcgregor Rd
- 11747 E Mcgregor Rd
- 11747 S Mcgregor Rd
- 11834 E Mcgregor Rd
- 11844 E Mcgregor Rd
- 11816 E Mcgregor Rd
- 7749 Dix Rd
- 11912 E Mcgregor Rd
- 11750 E Mcgregor Rd
- 11924 E Mcgregor Rd
- 11740 E Mcgregor Rd
- 11818 E Mcgregor Rd
- 11934 E Mcgregor Rd
- 7750 Dix Rd
- 11854 S Mcgregor Rd
- 11854 E Mcgregor Rd
- 11826 E Mcgregor Rd
- 7909 Dix Rd