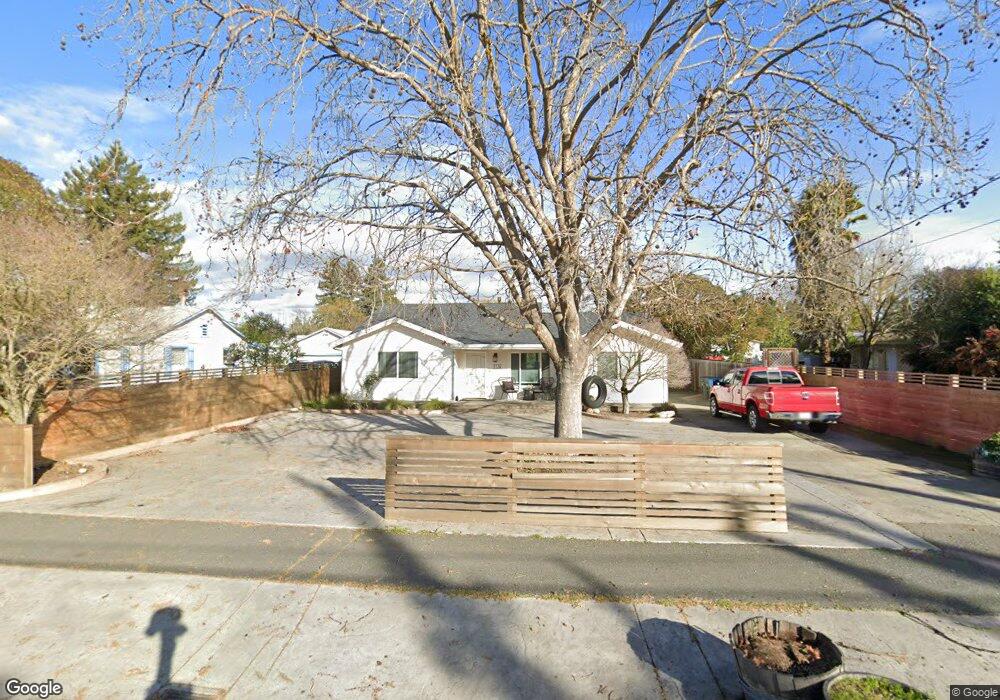
1174 Clover Dr Santa Rosa, CA 95401
Northwest Santa Rosa NeighborhoodEstimated Value: $606,000 - $736,267
4
Beds
2
Baths
1,780
Sq Ft
$381/Sq Ft
Est. Value
About This Home
This home is located at 1174 Clover Dr, Santa Rosa, CA 95401 and is currently estimated at $677,567, approximately $380 per square foot. 1174 Clover Dr is a home located in Sonoma County with nearby schools including Helen M. Lehman Elementary School, Hilliard Comstock Middle School, and Santa Rosa High School.
Ownership History
Date
Name
Owned For
Owner Type
Purchase Details
Closed on
Aug 25, 2020
Sold by
Walker Jason J and Walker Toni R
Bought by
Walker Toni R
Current Estimated Value
Home Financials for this Owner
Home Financials are based on the most recent Mortgage that was taken out on this home.
Original Mortgage
$510,400
Outstanding Balance
$448,812
Interest Rate
2.9%
Mortgage Type
New Conventional
Estimated Equity
$228,755
Purchase Details
Closed on
Oct 30, 1998
Sold by
Johnson Jared A
Bought by
Walker Jason J and Walker Toni R
Purchase Details
Closed on
Apr 15, 1997
Sold by
Harrah Plata Juan Jose and Harrah Plata Debra Lynn
Bought by
Walker Jason J and Walker Toni R
Home Financials for this Owner
Home Financials are based on the most recent Mortgage that was taken out on this home.
Original Mortgage
$144,500
Interest Rate
7.98%
Create a Home Valuation Report for This Property
The Home Valuation Report is an in-depth analysis detailing your home's value as well as a comparison with similar homes in the area
Home Values in the Area
Average Home Value in this Area
Purchase History
| Date | Buyer | Sale Price | Title Company |
|---|---|---|---|
| Walker Toni R | -- | Amrock Inc | |
| Walker Jason J | $85,454 | North Bay Title Co | |
| Walker Jason J | $149,000 | North Bay Title Co |
Source: Public Records
Mortgage History
| Date | Status | Borrower | Loan Amount |
|---|---|---|---|
| Open | Walker Toni R | $510,400 | |
| Previous Owner | Walker Jason J | $144,500 |
Source: Public Records
Tax History
| Year | Tax Paid | Tax Assessment Tax Assessment Total Assessment is a certain percentage of the fair market value that is determined by local assessors to be the total taxable value of land and additions on the property. | Land | Improvement |
|---|---|---|---|---|
| 2025 | $3,548 | $306,893 | $126,954 | $179,939 |
| 2024 | $3,548 | $300,876 | $124,465 | $176,411 |
| 2023 | $3,548 | $294,977 | $122,025 | $172,952 |
| 2022 | $3,278 | $289,194 | $119,633 | $169,561 |
| 2021 | $3,233 | $283,525 | $117,288 | $166,237 |
| 2020 | $3,225 | $280,619 | $116,086 | $164,533 |
| 2019 | $3,207 | $275,117 | $113,810 | $161,307 |
| 2018 | $3,188 | $269,724 | $111,579 | $158,145 |
| 2017 | $3,130 | $264,437 | $109,392 | $155,045 |
| 2016 | $3,102 | $259,253 | $107,248 | $152,005 |
| 2015 | $3,009 | $255,360 | $105,638 | $149,722 |
| 2014 | $2,827 | $250,359 | $103,569 | $146,790 |
Source: Public Records
Map
Nearby Homes
- 1230 Jennings Ave
- 786 Simpson Place
- 717 Blair Place
- 724 Agnew Place
- 1532 Sunview Ct
- 1728 Ensenada Ct
- 1540 Sunview Ct
- 595 N Dutton Ave
- 2599 Westberry Dr
- 2607 Westberry Dr
- 2310 Iroquois St
- 1820 Shelley Dr
- 1035 Maxwell Dr
- 1127 Cleveland Ave
- 2559 Northcoast St
- 100 Ridgway Ave
- 2660 Coffey Ln
- 2131 Naomi Place
- 1890 Dorado Ct
- 1708 Glenbrook Dr Unit F
Your Personal Tour Guide
Ask me questions while you tour the home.