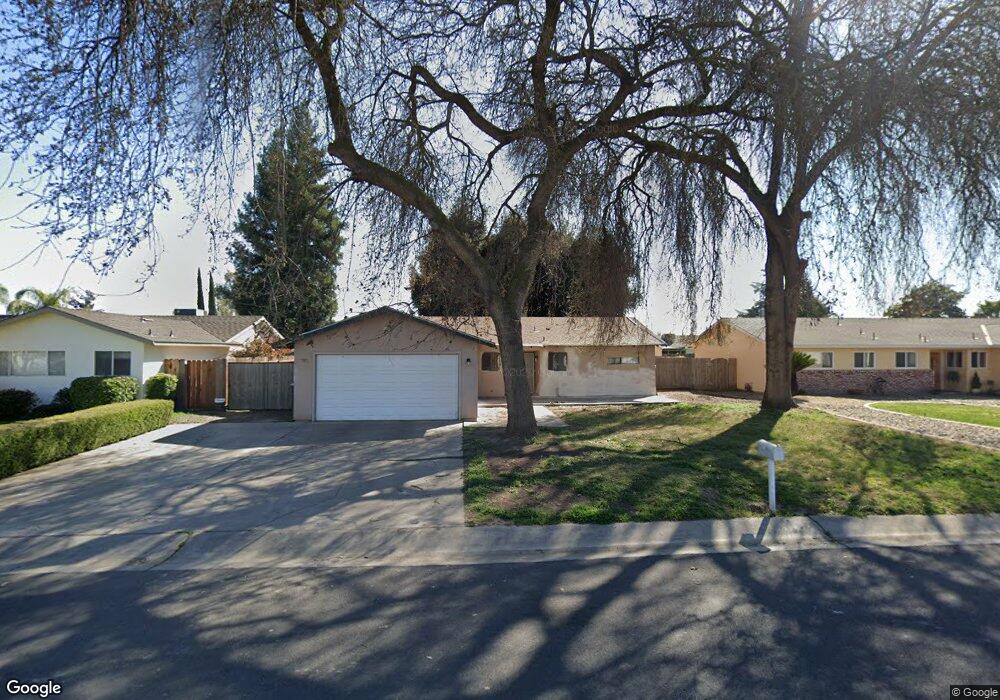
11745 Carleton Ave Tulare, CA 93274
Estimated Value: $219,000 - $379,000
3
Beds
3
Baths
1,504
Sq Ft
$223/Sq Ft
Est. Value
About This Home
This home is located at 11745 Carleton Ave, Tulare, CA 93274 and is currently estimated at $334,991, approximately $222 per square foot. 11745 Carleton Ave is a home located in Tulare County with nearby schools including Liberty Elementary School, Tulare Western High School, and Accelerated Charter High.
Ownership History
Date
Name
Owned For
Owner Type
Purchase Details
Closed on
Aug 30, 2017
Sold by
Benson John A
Bought by
Benson John A and Benson Dena M
Current Estimated Value
Purchase Details
Closed on
Feb 12, 2003
Sold by
Benson John A
Bought by
Benson Dena M
Home Financials for this Owner
Home Financials are based on the most recent Mortgage that was taken out on this home.
Original Mortgage
$89,000
Outstanding Balance
$36,975
Interest Rate
5.54%
Mortgage Type
Purchase Money Mortgage
Estimated Equity
$298,016
Purchase Details
Closed on
Mar 9, 2001
Sold by
Va
Bought by
Benson John A and Benson Dena M
Home Financials for this Owner
Home Financials are based on the most recent Mortgage that was taken out on this home.
Original Mortgage
$85,000
Interest Rate
7.11%
Mortgage Type
Purchase Money Mortgage
Create a Home Valuation Report for This Property
The Home Valuation Report is an in-depth analysis detailing your home's value as well as a comparison with similar homes in the area
Purchase History
| Date | Buyer | Sale Price | Title Company |
|---|---|---|---|
| Benson John A | -- | None Available | |
| Benson John A | -- | None Available | |
| Benson Dena M | -- | Cuesta Title | |
| Benson John A | -- | -- |
Source: Public Records
Mortgage History
| Date | Status | Borrower | Loan Amount |
|---|---|---|---|
| Open | Benson Dena M | $89,000 | |
| Closed | Benson John A | $85,000 |
Source: Public Records
Tax History
| Year | Tax Paid | Tax Assessment Tax Assessment Total Assessment is a certain percentage of the fair market value that is determined by local assessors to be the total taxable value of land and additions on the property. | Land | Improvement |
|---|---|---|---|---|
| 2025 | $670 | $68,480 | $9,600 | $58,880 |
| 2024 | $670 | $67,138 | $9,412 | $57,726 |
| 2023 | $656 | $65,823 | $9,228 | $56,595 |
| 2022 | $634 | $64,534 | $9,048 | $55,486 |
| 2021 | $623 | $63,269 | $8,871 | $54,398 |
| 2020 | $633 | $62,620 | $8,780 | $53,840 |
| 2019 | $648 | $61,392 | $8,608 | $52,784 |
| 2018 | $642 | $60,188 | $8,439 | $51,749 |
| 2017 | $639 | $59,008 | $8,274 | $50,734 |
| 2016 | $610 | $57,851 | $8,112 | $49,739 |
| 2015 | $588 | $56,982 | $7,990 | $48,992 |
| 2014 | $588 | $55,865 | $7,833 | $48,032 |
Source: Public Records
Map
Nearby Homes
- 0 N Mooney Blvd
- 26814 S Mooney Blvd Unit D140
- 3116 Seymour St
- 2090 Chancellor Ave
- 3125 Seymour St
- 3625 Chelsea St
- 11590 Avenue 272
- 27274 S Mooney Blvd
- 2158 Bolton Ave
- 3224 Dorset St
- 1762 Bolton Ave
- 2627 W Midvalley Ave Unit 107
- 2627 W Midvalley Ave
- 2627 W Midvalley Ave Unit 46
- 2627 W Midvalley Ave Unit 95
- 2627 W Midvalley Ave Unit 134
- Midvalley W Mid Valley Ave Site Ave
- 2886 Dorset St Unit Sor40
- 2910 Dorset St Unit Sor43
- 2874 Dorset St Unit Sor39
- 11757 Carleton Ave
- 11733 Carleton Ave
- 11744 Avenue 261
- 11756 Avenue 261
- 11721 Carleton Ave
- 11732 Avenue 261
- 11769 Carleton Ave
- 11786 Avenue 261
- 11720 Avenue 261
- 11744 Carleton Ave
- 11732 Carleton Ave
- 11713 Carleton Ave
- 11758 Carleton Ave
- 11712 Avenue 261
- 11718 Carleton Ave
- 11770 Carleton Ave
- 26128 Road 118
- 11703 Carleton Ave
- 26154 Road 118
- 11749 Avenue 261
Your Personal Tour Guide
Ask me questions while you tour the home.