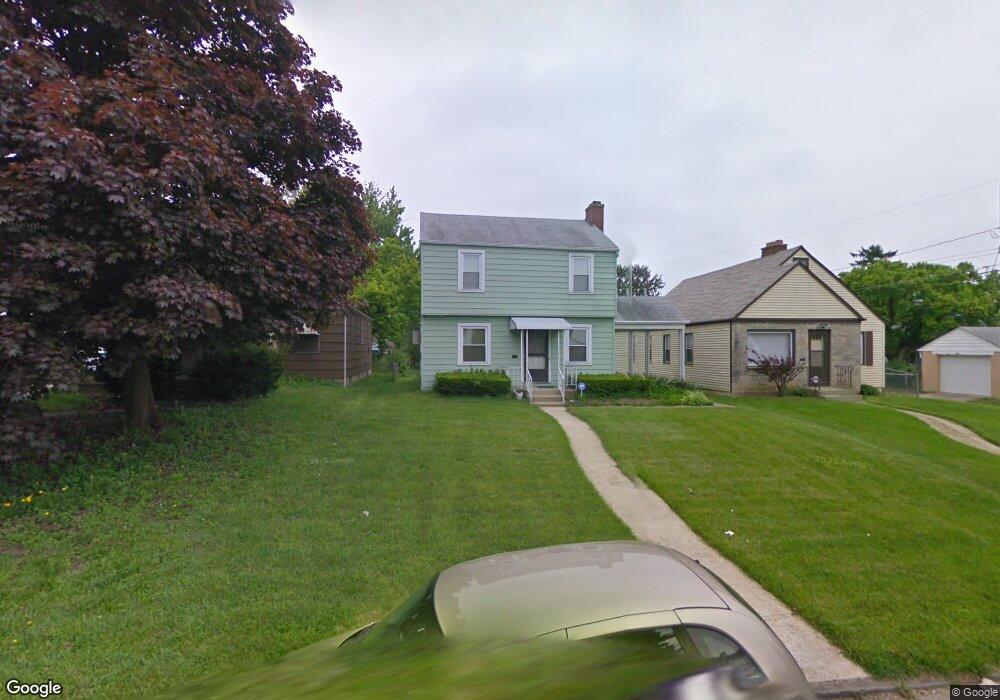
1175 Berkeley Rd Columbus, OH 43206
Deshler Park NeighborhoodEstimated Value: $166,000 - $215,000
3
Beds
1
Bath
1,206
Sq Ft
$164/Sq Ft
Est. Value
About This Home
This home is located at 1175 Berkeley Rd, Columbus, OH 43206 and is currently estimated at $197,667, approximately $163 per square foot. 1175 Berkeley Rd is a home located in Franklin County with nearby schools including Moler Elementary School, South High School, and Capital Collegiate Preparatory Academy.
Ownership History
Date
Name
Owned For
Owner Type
Purchase Details
Closed on
Dec 20, 2011
Sold by
Martin Chris and Martin Christina
Bought by
Mnm Home Rentals Group Llc
Current Estimated Value
Purchase Details
Closed on
Jun 24, 2011
Sold by
Zip Line Ventures Llc
Bought by
Martin Chris
Purchase Details
Closed on
Jun 1, 2011
Sold by
Telhio Credit Union
Bought by
Zip Line Ventures Llc
Purchase Details
Closed on
Mar 16, 2011
Sold by
Hadden Rhoda J and Case #10 Cve 07 10051
Bought by
Telhio Credit Union
Purchase Details
Closed on
Oct 8, 1969
Bought by
Hadden Rhoda J
Create a Home Valuation Report for This Property
The Home Valuation Report is an in-depth analysis detailing your home's value as well as a comparison with similar homes in the area
Home Values in the Area
Average Home Value in this Area
Purchase History
| Date | Buyer | Sale Price | Title Company |
|---|---|---|---|
| Mnm Home Rentals Group Llc | -- | None Available | |
| Martin Chris | $7,000 | Attorney | |
| Zip Line Ventures Llc | $7,000 | Valmer | |
| Telhio Credit Union | $28,000 | Attorney | |
| Hadden Rhoda J | -- | -- |
Source: Public Records
Tax History Compared to Growth
Tax History
| Year | Tax Paid | Tax Assessment Tax Assessment Total Assessment is a certain percentage of the fair market value that is determined by local assessors to be the total taxable value of land and additions on the property. | Land | Improvement |
|---|---|---|---|---|
| 2024 | $2,467 | $53,840 | $11,870 | $41,970 |
| 2023 | $2,437 | $53,830 | $11,865 | $41,965 |
| 2022 | $646 | $12,150 | $2,660 | $9,490 |
| 2021 | $647 | $12,150 | $2,660 | $9,490 |
| 2020 | $648 | $12,150 | $2,660 | $9,490 |
| 2019 | $631 | $10,150 | $2,240 | $7,910 |
| 2018 | $315 | $10,150 | $2,240 | $7,910 |
| 2017 | $1,092 | $17,570 | $2,240 | $15,330 |
| 2016 | $524 | $7,710 | $3,470 | $4,240 |
| 2015 | $238 | $7,710 | $3,470 | $4,240 |
| 2014 | $478 | $7,710 | $3,470 | $4,240 |
| 2013 | $416 | $12,250 | $4,060 | $8,190 |
Source: Public Records
Map
Nearby Homes
- 1417 E Whittier St
- 1184-1186 Lilley Ave
- 1485 E Whittier St
- 1095 Berkeley Rd
- 1189 Fairwood Ave
- 1337 E Kossuth St Unit 1339
- 1109 Fairwood Ave
- 954 Miller Ave
- 991 Lilley Ave
- 1614 E Whittier St Unit 1614/1616
- 1424 E Deshler Ave
- 1634 E Whittier St
- 1021-1023 Miller Ave
- 959 Kelton Ave
- 980 Miller Ave
- 993 Miller Ave Unit 995
- 1671-1673 E Whittier St
- 1025 Lockbourne Rd Unit 27
- 1689 E Kossuth St
- 1363 Kelton Ave
- 1171 Berkeley Rd
- 1181 Berkeley Rd
- 1189 Berkeley Rd
- 1193 Berkeley Rd
- 1433 E Whittier St
- 1435 E Whittier St
- 1427 E Whittier St
- 1443 E Whittier St
- 1168 Lilley Ave
- 894 Berkeley Rd
- 1421 E Whittier St
- 1197 Berkeley Rd
- 1180 Lilley Ave
- 1172 Lilley Ave Unit 174
- 1172 Lilley Ave
- 1184-1186 Lilley Ave Unit 2
- 1184 Lilley Ave Unit 186
- 1178 Berkeley Rd
- 1182 Berkeley Rd
- 1455 E Whittier St