Estimated Value: $415,385
Studio
--
Bath
2,812
Sq Ft
$148/Sq Ft
Est. Value
About This Home
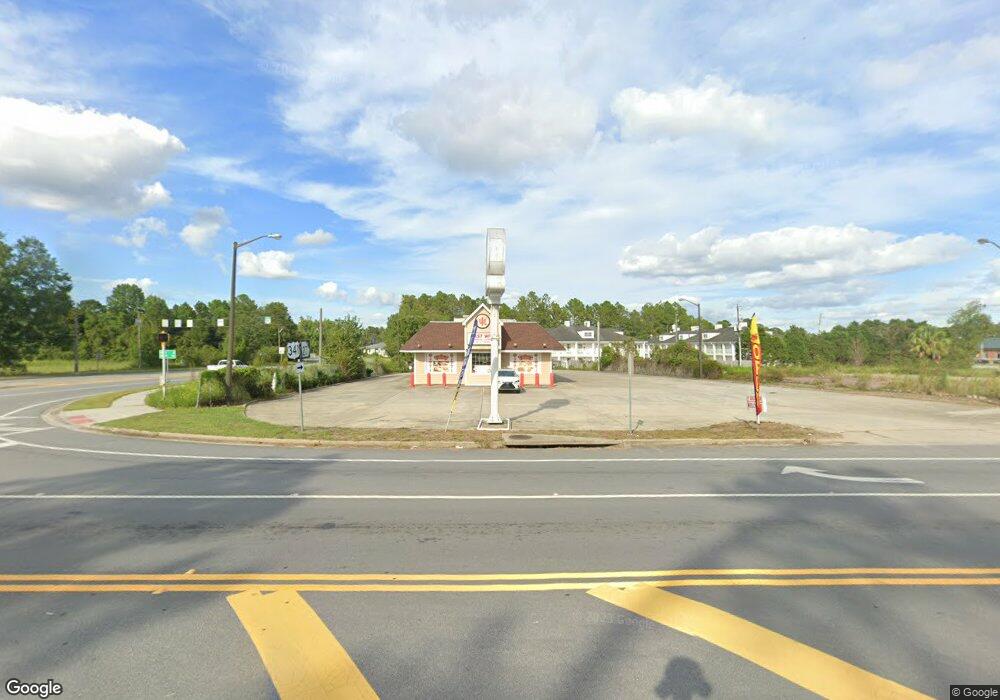
This home is located at 1175 E Cherry St, Jesup, GA 31546 and is currently priced at $415,385, approximately $147 per square foot. 1175 E Cherry St is a home located in Wayne County with nearby schools including Jesup Elementary School, Arthur Williams Middle School, and Wayne County High School.
Ownership History
Date
Name
Owned For
Owner Type
Purchase Details
Closed on
Dec 15, 2021
Sold by
Yang Joey
Bought by
Cherry Commercial Properties Llc
Current Estimated Value
Purchase Details
Closed on
Mar 5, 2021
Sold by
Wonerful Estate Inc
Bought by
Yang Joey Qiu
Purchase Details
Closed on
Nov 20, 2019
Sold by
Li Jie
Bought by
Wonderful Estate Inc
Purchase Details
Closed on
Jan 31, 2017
Sold by
Bas Realty Llc
Bought by
Li Jie
Purchase Details
Closed on
Jun 29, 2011
Sold by
Williams Lenworth
Bought by
Barton Kevin C and Barton Meagan R
Purchase Details
Closed on
Jul 1, 2001
Sold by
Sluder Ronald E
Bought by
Bas Realty Llc
Purchase Details
Closed on
May 1, 2000
Bought by
Sluder Ronald E
Purchase Details
Closed on
Jul 1, 1999
Purchase Details
Closed on
Jul 1, 1998
Purchase Details
Closed on
Nov 1, 1996
Purchase Details
Closed on
May 1, 1994
Purchase Details
Closed on
Feb 1, 1987
Create a Home Valuation Report for This Property
The Home Valuation Report is an in-depth analysis detailing your home's value as well as a comparison with similar homes in the area
Purchase History
| Date | Buyer | Sale Price | Title Company |
|---|---|---|---|
| Cherry Commercial Properties Llc | $12,500 | -- | |
| Yang Joey Qiu | -- | -- | |
| Wonderful Estate Inc | -- | -- | |
| Li Jie | $200,000 | -- | |
| Barton Kevin C | $24,000 | -- | |
| Bas Realty Llc | $345,000 | -- | |
| Sluder Ronald E | $275,000 | -- | |
| -- | -- | -- | |
| -- | $580,000 | -- | |
| -- | $429,000 | -- | |
| -- | $50,000 | -- | |
| -- | -- | -- |
Source: Public Records
Tax History
| Year | Tax Paid | Tax Assessment Tax Assessment Total Assessment is a certain percentage of the fair market value that is determined by local assessors to be the total taxable value of land and additions on the property. | Land | Improvement |
|---|---|---|---|---|
| 2025 | $5,174 | $163,950 | $72,107 | $91,843 |
| 2024 | $4,437 | $145,073 | $72,107 | $72,966 |
| 2023 | $5,393 | $152,455 | $72,107 | $80,348 |
| 2022 | $4,781 | $151,849 | $71,501 | $80,348 |
| 2021 | $5,120 | $151,849 | $71,501 | $80,348 |
| 2020 | $5,297 | $151,849 | $71,501 | $80,348 |
| 2019 | $5,455 | $151,849 | $71,501 | $80,348 |
| 2018 | $2,874 | $151,849 | $71,501 | $80,348 |
Source: Public Records
Map
Nearby Homes
Your Personal Tour Guide
Ask me questions while you tour the home.