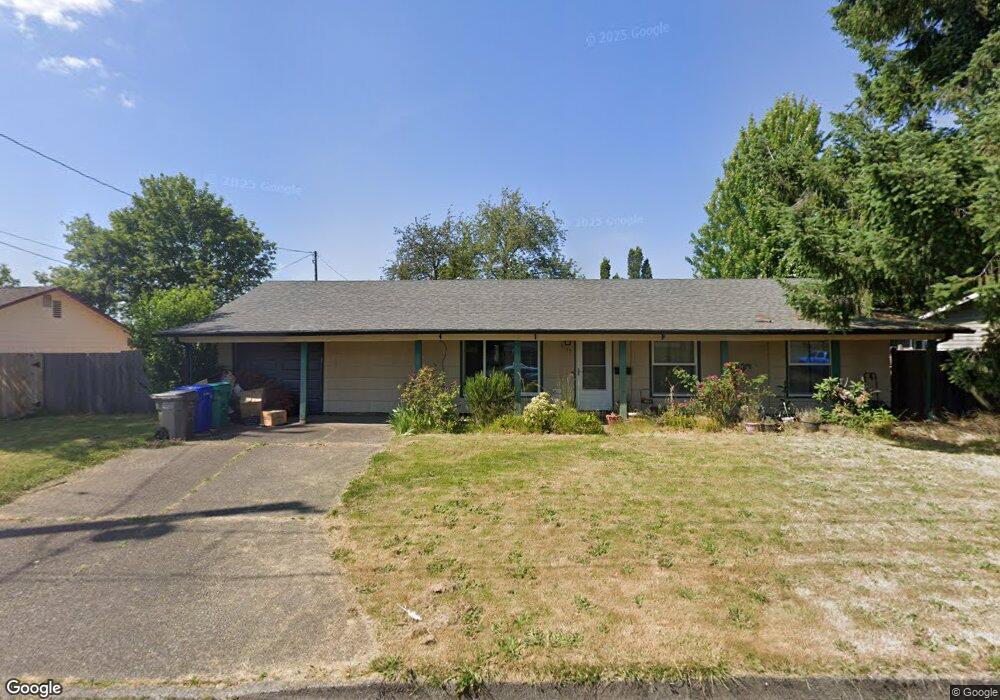
1175 SE 2nd St Gresham, OR 97080
Historic Southeast NeighborhoodEstimated Value: $387,000 - $408,000
3
Beds
1
Bath
1,152
Sq Ft
$344/Sq Ft
Est. Value
About This Home
This home is located at 1175 SE 2nd St, Gresham, OR 97080 and is currently estimated at $396,595, approximately $344 per square foot. 1175 SE 2nd St is a home located in Multnomah County with nearby schools including East Gresham Elementary School, Dexter McCarty Middle School, and Gresham High School.
Ownership History
Date
Name
Owned For
Owner Type
Purchase Details
Closed on
Oct 28, 2020
Sold by
Abbott Casey E and Malanche Abbott Leslie
Bought by
Abbott Casey E and Malanche Abbott Leslie
Current Estimated Value
Home Financials for this Owner
Home Financials are based on the most recent Mortgage that was taken out on this home.
Original Mortgage
$227,500
Outstanding Balance
$201,517
Interest Rate
2.8%
Mortgage Type
New Conventional
Estimated Equity
$195,078
Purchase Details
Closed on
Jan 17, 2005
Sold by
Rundle Jack Joseph
Bought by
Abbott Casey E and Malanche Leslie P
Home Financials for this Owner
Home Financials are based on the most recent Mortgage that was taken out on this home.
Original Mortgage
$157,429
Interest Rate
5.67%
Mortgage Type
FHA
Purchase Details
Closed on
Dec 2, 2002
Sold by
Citifinancial Mtg Company Inc
Bought by
Rundle Jack Joseph
Home Financials for this Owner
Home Financials are based on the most recent Mortgage that was taken out on this home.
Original Mortgage
$114,109
Interest Rate
6.28%
Mortgage Type
FHA
Create a Home Valuation Report for This Property
The Home Valuation Report is an in-depth analysis detailing your home's value as well as a comparison with similar homes in the area
Home Values in the Area
Average Home Value in this Area
Purchase History
| Date | Buyer | Sale Price | Title Company |
|---|---|---|---|
| Abbott Casey E | -- | Chicago Title | |
| Abbott Casey E | $159,900 | Transnation Title Agency Or | |
| Rundle Jack Joseph | $115,900 | First American |
Source: Public Records
Mortgage History
| Date | Status | Borrower | Loan Amount |
|---|---|---|---|
| Open | Abbott Casey E | $227,500 | |
| Closed | Abbott Casey E | $157,429 | |
| Previous Owner | Rundle Jack Joseph | $114,109 |
Source: Public Records
Tax History
| Year | Tax Paid | Tax Assessment Tax Assessment Total Assessment is a certain percentage of the fair market value that is determined by local assessors to be the total taxable value of land and additions on the property. | Land | Improvement |
|---|---|---|---|---|
| 2025 | $3,762 | $184,880 | -- | -- |
| 2024 | $3,601 | $179,500 | -- | -- |
| 2023 | $3,281 | $174,280 | $0 | $0 |
| 2022 | $3,190 | $169,210 | $0 | $0 |
| 2021 | $3,109 | $164,290 | $0 | $0 |
| 2020 | $2,926 | $159,510 | $0 | $0 |
| 2019 | $2,849 | $154,870 | $0 | $0 |
| 2018 | $2,717 | $150,360 | $0 | $0 |
| 2017 | $2,607 | $145,990 | $0 | $0 |
| 2016 | $2,298 | $141,740 | $0 | $0 |
Source: Public Records
Map
Nearby Homes
- 4740 SE 2nd St
- 4764 SE 2nd St
- 4667 SE 2nd St
- 1715 SE 5th St Unit 1725
- 0 NE 6th St
- 450 SE Hogan Rd
- 491 NE Elliott Ave
- 415 SE Roberts Ave
- 417 SE Roberts Ave
- 894 NE Linden Ave
- 900 NE Francis Ave Unit 29
- 900 NE Francis Ave
- 900 NE Francis Ave Unit 63
- 660 NE 9th St
- 955 SE Hogan Rd
- 318 NE Roberts Ave Unit 308
- 318 NE Roberts Ave Unit 203
- 732 SE Rene Ave
- 579 NE Fleming Ave Unit C41
- 0 SE 1st St
- 1225 SE 2nd St
- 1145 SE 2nd St
- 1210 SE 2nd St
- 1255 SE 2nd St
- 1125 SE 2nd St
- 1220 SE 2nd St
- 1130 SE 2nd St
- 200 SE Evelyn Ave
- 1075 SE 2nd St
- 225 SE Liberty Ct
- 1285 SE 2nd St
- 185 SE Evelyn Ave
- 1050 SE 2nd St
- 220 SE Evelyn Ave
- 1270 SE 2nd St
- 1025 SE 2nd St
- 235 SE Liberty Ct
- 225 SE Evelyn Ave
- 180 SE Morlan Ave
- 1304 E Powell Blvd Unit 2
Your Personal Tour Guide
Ask me questions while you tour the home.