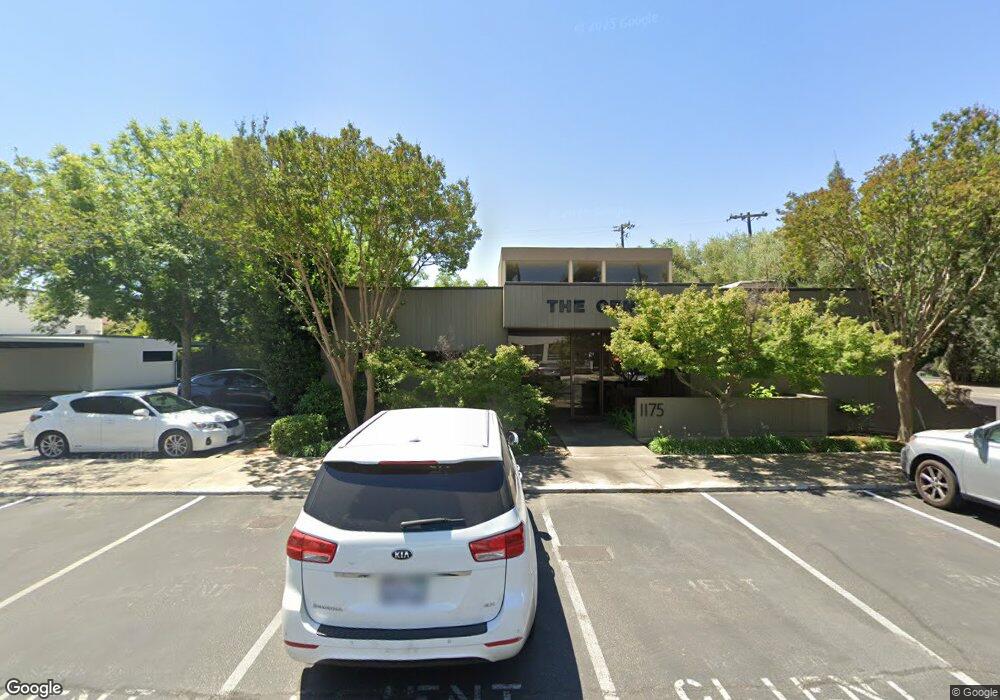
1175 W Shaw Ave Unit 101 Fresno, CA 93711
Bullard Neighborhood
--
Bed
--
Bath
1,900
Sq Ft
0.29
Acres
About This Home
This home is located at 1175 W Shaw Ave Unit 101, Fresno, CA 93711. 1175 W Shaw Ave Unit 101 is a home located in Fresno County with nearby schools including Powers-Ginsburg Elementary, Bullard High School, and Endeavor Charter.
Ownership History
Date
Name
Owned For
Owner Type
Purchase Details
Closed on
Feb 6, 2020
Sold by
Cm Stroung Llc
Bought by
Ollin Llc
Purchase Details
Closed on
Jul 12, 2011
Sold by
Richburg Brian
Bought by
Martin Bryan L and Martin Jennifer J
Home Financials for this Owner
Home Financials are based on the most recent Mortgage that was taken out on this home.
Original Mortgage
$46,500
Interest Rate
4.5%
Mortgage Type
Commercial
Purchase Details
Closed on
Jun 2, 2005
Sold by
The Mccaffrey Group
Bought by
Cm Strong Llc
Home Financials for this Owner
Home Financials are based on the most recent Mortgage that was taken out on this home.
Original Mortgage
$265,000
Interest Rate
5.56%
Mortgage Type
Commercial
Purchase Details
Closed on
Jan 8, 2002
Sold by
The Mccaffrey Group Inc
Bought by
The Mccaffrey Group Inc
Purchase Details
Closed on
Jan 26, 1995
Sold by
Mccaffrey Development L P
Bought by
Mccaffrey Robert A and Mccaffrey Karen
Create a Home Valuation Report for This Property
The Home Valuation Report is an in-depth analysis detailing your home's value as well as a comparison with similar homes in the area
Home Values in the Area
Average Home Value in this Area
Purchase History
| Date | Buyer | Sale Price | Title Company |
|---|---|---|---|
| Ollin Llc | $1,578,500 | None Available | |
| Martin Bryan L | $58,500 | Chicago Title Company | |
| Cm Strong Llc | $527,500 | Fidelity National Title Co | |
| The Mccaffrey Group Inc | -- | -- | |
| Mccaffrey Robert A | -- | Stewart Title |
Source: Public Records
Mortgage History
| Date | Status | Borrower | Loan Amount |
|---|---|---|---|
| Previous Owner | Martin Bryan L | $46,500 | |
| Previous Owner | Cm Strong Llc | $265,000 |
Source: Public Records
Tax History Compared to Growth
Tax History
| Year | Tax Paid | Tax Assessment Tax Assessment Total Assessment is a certain percentage of the fair market value that is determined by local assessors to be the total taxable value of land and additions on the property. | Land | Improvement |
|---|---|---|---|---|
| 2025 | $5,505 | $512,200 | $170,000 | $342,200 |
| 2023 | $5,126 | $392,200 | $120,000 | $272,200 |
| 2022 | $5,156 | $392,200 | $120,000 | $272,200 |
| 2021 | $5,115 | $392,200 | $120,000 | $272,200 |
| 2020 | $5,144 | $392,200 | $120,000 | $272,200 |
| 2019 | $4,672 | $362,200 | $100,000 | $262,200 |
| 2018 | $4,662 | $362,200 | $100,000 | $262,200 |
| 2017 | $4,672 | $362,200 | $100,000 | $262,200 |
| 2016 | $4,301 | $337,200 | $90,000 | $247,200 |
| 2015 | $4,300 | $337,200 | $90,000 | $247,200 |
| 2014 | $3,949 | $309,300 | $90,000 | $219,300 |
Source: Public Records
Map
Nearby Homes
- 116 E Alamos Ave
- 4822 N Safford Ave
- 4843 N Palm Ave
- 4939 N Fruit Ave
- 4734 N Harrison Ave
- 4678 N Thorne Ave
- 4666 N Harrison Ave
- 4702 N Fruit Ave
- 1473 W Scott Ave
- 709 W Alamos Ave
- 4915 N Wishon Ct
- 638 W Rialto Ave
- 1159 W San Madele Ave
- 5090 N Roosevelt Ave Unit 11
- 5180 N Wishon Ave Unit 201
- 5180 N Wishon Ave Unit 103
- 336 E Gettysburg Ave
- 4689 N Van Ness Blvd
- 5048 N Wishon Ave Unit E
- 705 E Alamos Ave
- 4951 N Thorne Ave
- 4949 N Thorne Ave
- 4919 N Thorne Ave
- 4916 N Thorne Ave
- 4920 N Thorne Ave
- 4928 N Thorne Ave
- 4924 N Thorne Ave
- 4909 N Thorne Ave
- 1233 W Shaw Ave Unit 101
- 4894 N Thorne Ave
- 4884 N Thorne Ave
- 4933 N Harrison Ave
- 4915 N Harrison Ave
- 4895 N Thorne Ave
- 4878 N Thorne Ave
- 4905 N Harrison Ave
- 1170 W Shaw Ave Unit 1-105
- 1255 W Shaw Ave
- 4866 N Thorne Ave
- 4873 N Thorne Ave