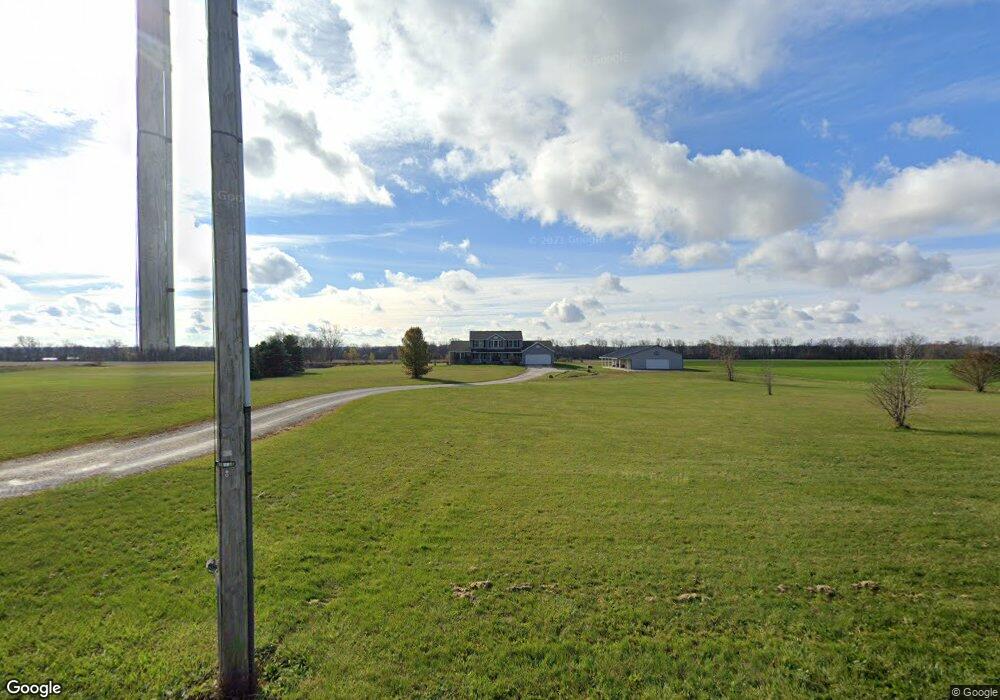
11750 County Road 106 Kenton, OH 43326
Estimated Value: $375,000 - $554,000
4
Beds
3
Baths
3,220
Sq Ft
$141/Sq Ft
Est. Value
About This Home
This home is located at 11750 County Road 106, Kenton, OH 43326 and is currently estimated at $452,923, approximately $140 per square foot. 11750 County Road 106 is a home located in Hardin County with nearby schools including Kenton Elementary School, Kenton Middle School, and Kenton High School.
Ownership History
Date
Name
Owned For
Owner Type
Purchase Details
Closed on
Dec 18, 2017
Sold by
Totten Kimberly
Bought by
Totten Ryan
Current Estimated Value
Purchase Details
Closed on
Sep 29, 2004
Bought by
Totten Ryan
Purchase Details
Closed on
Jul 16, 1999
Bought by
Totten Ryan and Totten Andrea
Purchase Details
Closed on
May 13, 1998
Bought by
Clemons Janice
Purchase Details
Closed on
Apr 23, 1997
Bought by
Nitchie Earnest S
Purchase Details
Closed on
Feb 25, 1995
Bought by
Mckinley Roger
Purchase Details
Closed on
Oct 20, 1993
Bought by
Kaylor Gladys S
Purchase Details
Closed on
May 25, 1993
Bought by
Kaylor Gladys S
Purchase Details
Closed on
Apr 16, 1993
Bought by
Kaylor Gladys S
Purchase Details
Closed on
Feb 5, 1993
Bought by
Kaylor Gladys S
Create a Home Valuation Report for This Property
The Home Valuation Report is an in-depth analysis detailing your home's value as well as a comparison with similar homes in the area
Home Values in the Area
Average Home Value in this Area
Purchase History
| Date | Buyer | Sale Price | Title Company |
|---|---|---|---|
| Totten Ryan | -- | None Available | |
| Totten Ryan | -- | -- | |
| Totten Ryan | $23,000 | -- | |
| Clemons Janice | $9,000 | -- | |
| Nitchie Earnest S | $19,000 | -- | |
| Mckinley Roger | -- | -- | |
| Kaylor Gladys S | $25,000 | -- | |
| Kaylor Gladys S | $11,300 | -- | |
| Kaylor Gladys S | $8,500 | -- | |
| Kaylor Gladys S | $7,500 | -- |
Source: Public Records
Tax History Compared to Growth
Tax History
| Year | Tax Paid | Tax Assessment Tax Assessment Total Assessment is a certain percentage of the fair market value that is determined by local assessors to be the total taxable value of land and additions on the property. | Land | Improvement |
|---|---|---|---|---|
| 2024 | $5,409 | $126,140 | $13,870 | $112,270 |
| 2023 | $5,409 | $126,140 | $13,870 | $112,270 |
| 2022 | $4,749 | $105,120 | $9,580 | $95,540 |
| 2021 | $4,767 | $105,120 | $9,580 | $95,540 |
| 2020 | $4,118 | $105,120 | $9,580 | $95,540 |
| 2019 | $3,568 | $95,070 | $9,370 | $85,700 |
| 2018 | $3,603 | $95,910 | $9,370 | $86,540 |
| 2017 | $3,429 | $95,910 | $9,370 | $86,540 |
| 2016 | $3,308 | $94,100 | $8,840 | $85,260 |
| 2015 | $3,264 | $94,100 | $8,840 | $85,260 |
| 2014 | $3,307 | $94,100 | $8,840 | $85,260 |
| 2013 | $3,798 | $102,390 | $8,840 | $93,550 |
Source: Public Records
Map
Nearby Homes
- 1255 W North St Unit Lot 47
- 368 N Ida St
- 723 W Lima St Unit 66
- 723 W Lima St Unit 1
- 726 Tracy St
- 702 W Franklin St Unit 702 1/2
- 0 Ohio 309
- 416 Center St
- 609 W North St
- 424 W Carrol St
- 310 N Market St
- 219 W Carrol St
- 328 N Detroit St
- 233 N Main St
- 215 N Main St
- 299 Marie Ave
- 416 N Cherry St
- 416 E Eliza St
- 109 Lark Ln
- 0 N Barron St
- 11804 County Road 106
- 11749 County Road 106
- 11872 County Road 106
- 11815 County Road 106
- 11585 County Road 106
- 11585 County Road 106
- 11942 Cr
- 11535 County Road 106
- 11535 County Road 106
- 10801 Township Road 135
- 10873 Township Road 135
- 10975 Township Road 135
- 10751 Township Road 135
- 11065 Township Road 135
- 10653 Township Road 135
- 10653 Twp Rd
- 10653 Tr
- 12100 County Road 106
- 12156 County Road 106