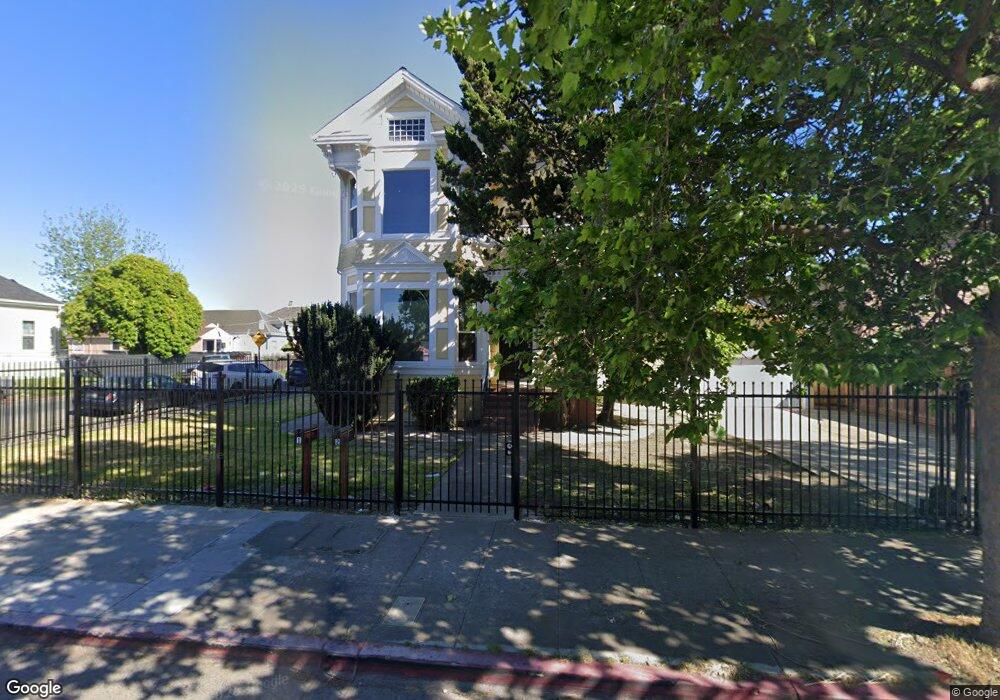
1176 98th Ave Oakland, CA 94603
North Stonehurst NeighborhoodEstimated Value: $593,000 - $712,000
3
Beds
2
Baths
2,286
Sq Ft
$282/Sq Ft
Est. Value
About This Home
This home is located at 1176 98th Ave, Oakland, CA 94603 and is currently estimated at $643,549, approximately $281 per square foot. 1176 98th Ave is a home located in Alameda County with nearby schools including Fred T. Korematsu Discovery Academy, Esperanza Elementary School, and Elmhurst United Middle School.
Ownership History
Date
Name
Owned For
Owner Type
Purchase Details
Closed on
Jan 5, 2024
Sold by
Western Progressive Llc
Bought by
Garron Linda B
Current Estimated Value
Home Financials for this Owner
Home Financials are based on the most recent Mortgage that was taken out on this home.
Original Mortgage
$168,000
Outstanding Balance
$139,095
Interest Rate
7.22%
Mortgage Type
New Conventional
Estimated Equity
$504,454
Purchase Details
Closed on
Sep 12, 2007
Sold by
Garron Linda B
Bought by
Garron Linda B and Armour Donald
Create a Home Valuation Report for This Property
The Home Valuation Report is an in-depth analysis detailing your home's value as well as a comparison with similar homes in the area
Home Values in the Area
Average Home Value in this Area
Purchase History
| Date | Buyer | Sale Price | Title Company |
|---|---|---|---|
| Garron Linda B | $156,000 | None Listed On Document | |
| Garron Linda B | -- | None Available |
Source: Public Records
Mortgage History
| Date | Status | Borrower | Loan Amount |
|---|---|---|---|
| Open | Garron Linda B | $168,000 |
Source: Public Records
Tax History
| Year | Tax Paid | Tax Assessment Tax Assessment Total Assessment is a certain percentage of the fair market value that is determined by local assessors to be the total taxable value of land and additions on the property. | Land | Improvement |
|---|---|---|---|---|
| 2025 | $8,605 | $479,400 | $153,000 | $326,400 |
| 2024 | $8,605 | $231,717 | $61,889 | $176,828 |
| 2023 | $9,528 | $227,037 | $60,676 | $173,361 |
| 2022 | $9,216 | $222,448 | $59,486 | $169,962 |
| 2021 | $7,642 | $217,950 | $58,320 | $166,630 |
| 2020 | $5,267 | $222,644 | $57,722 | $164,922 |
| 2019 | $7,831 | $218,280 | $56,591 | $161,689 |
| 2018 | $4,336 | $214,000 | $55,481 | $158,519 |
| 2017 | $4,121 | $209,804 | $54,393 | $155,411 |
| 2016 | $3,919 | $205,691 | $53,327 | $152,364 |
| 2015 | $4,455 | $202,602 | $52,526 | $150,076 |
| 2014 | $4,451 | $198,634 | $51,497 | $147,137 |
Source: Public Records
Map
Nearby Homes
- 9820 B St
- 9847 A St
- 1260 96th Ave
- 1211 96th Ave
- 9624 E St
- 7 Town Square Place
- 9821 E St
- 9430 C St
- 9419 B St
- 9639 International Blvd
- 9939 International Blvd
- 10200 Royal Ann St
- 9920 International Blvd
- 9996 International Blvd
- 9625 Armstrong Dr
- 9337 International Blvd
- 1418 102nd Ave
- 1332 103rd Ave
- 9251 International Blvd
- 1324 104th Ave
Your Personal Tour Guide
Ask me questions while you tour the home.