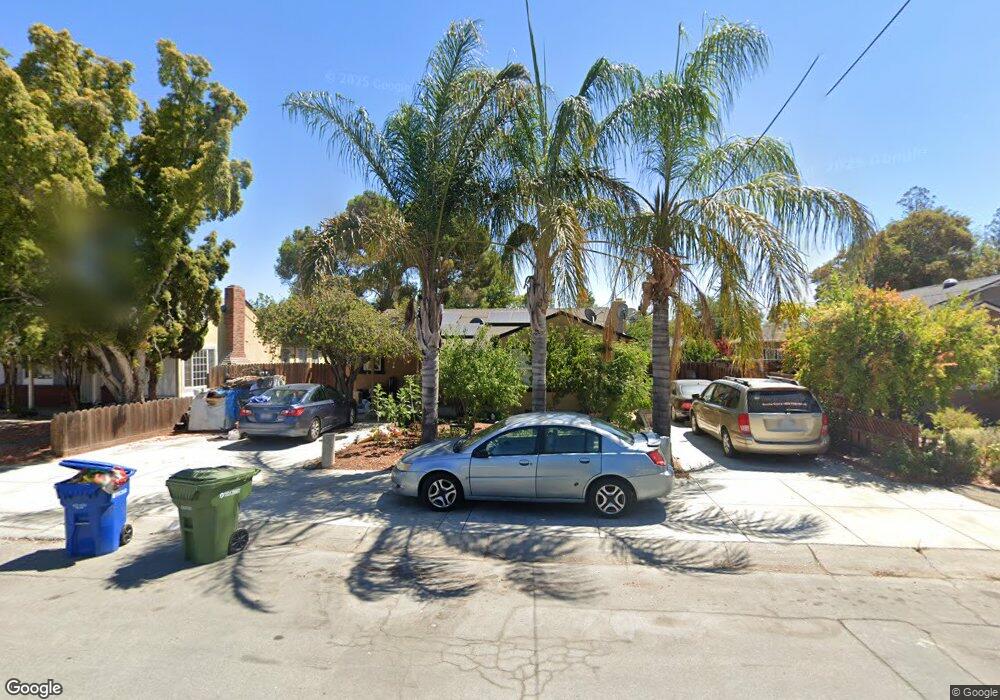
1176 Erin Way Campbell, CA 95008
Estimated Value: $1,324,000 - $1,972,000
3
Beds
2
Baths
1,642
Sq Ft
$1,064/Sq Ft
Est. Value
About This Home
This home is located at 1176 Erin Way, Campbell, CA 95008 and is currently estimated at $1,747,521, approximately $1,064 per square foot. 1176 Erin Way is a home located in Santa Clara County with nearby schools including Branham High School, Farnham Elementary School, and Fammatre Elementary School.
Ownership History
Date
Name
Owned For
Owner Type
Purchase Details
Closed on
May 26, 2006
Sold by
Patel Prakash
Bought by
Patel Parul Prakash
Current Estimated Value
Home Financials for this Owner
Home Financials are based on the most recent Mortgage that was taken out on this home.
Original Mortgage
$548,000
Outstanding Balance
$321,277
Interest Rate
6.52%
Mortgage Type
Stand Alone First
Estimated Equity
$1,426,244
Purchase Details
Closed on
Jul 11, 2002
Sold by
Crosbie Robert J
Bought by
Valdivia Toribio and Valdivia Luz
Home Financials for this Owner
Home Financials are based on the most recent Mortgage that was taken out on this home.
Original Mortgage
$280,000
Interest Rate
5.5%
Purchase Details
Closed on
Apr 26, 1996
Sold by
Crosbie Robert J and Crosbie Gladys M
Bought by
Crosbie Robert J and Crosbie Gladys M
Create a Home Valuation Report for This Property
The Home Valuation Report is an in-depth analysis detailing your home's value as well as a comparison with similar homes in the area
Home Values in the Area
Average Home Value in this Area
Purchase History
| Date | Buyer | Sale Price | Title Company |
|---|---|---|---|
| Patel Parul Prakash | -- | Financial Title Company | |
| Patel Parul Prakash | $685,000 | Financial Title Company | |
| Valdivia Toribio | $400,000 | American Title Co | |
| Crosbie Robert J | -- | -- |
Source: Public Records
Mortgage History
| Date | Status | Borrower | Loan Amount |
|---|---|---|---|
| Open | Patel Parul Prakash | $548,000 | |
| Previous Owner | Valdivia Toribio | $280,000 |
Source: Public Records
Tax History Compared to Growth
Tax History
| Year | Tax Paid | Tax Assessment Tax Assessment Total Assessment is a certain percentage of the fair market value that is determined by local assessors to be the total taxable value of land and additions on the property. | Land | Improvement |
|---|---|---|---|---|
| 2025 | $12,572 | $936,092 | $778,944 | $157,148 |
| 2024 | $12,572 | $917,738 | $763,671 | $154,067 |
| 2023 | $12,551 | $899,745 | $748,698 | $151,047 |
| 2022 | $12,353 | $882,104 | $734,018 | $148,086 |
| 2021 | $12,126 | $864,809 | $719,626 | $145,183 |
| 2020 | $11,581 | $855,943 | $712,248 | $143,695 |
| 2019 | $11,422 | $839,161 | $698,283 | $140,878 |
| 2018 | $11,078 | $822,708 | $684,592 | $138,116 |
| 2017 | $10,854 | $806,577 | $671,169 | $135,408 |
| 2016 | $10,318 | $790,762 | $658,009 | $132,753 |
| 2015 | $10,166 | $778,885 | $648,126 | $130,759 |
| 2014 | $9,907 | $763,629 | $635,431 | $128,198 |
Source: Public Records
Map
Nearby Homes
- 1500 Camden Ave
- 2785 S Bascom Ave Unit 26
- 2277 Sun Glory Ln Unit B
- 2258 Highland Park Ln
- 866 Stonehurst Way
- 2888 Lantz Ave
- 3449 Wine Cask Way
- 3489 Wine Barrel Way
- 14 Timber Cove Dr Unit 14
- 99 Timber Cove Dr Unit 99
- 870 Camden Ave Unit 96
- 3076 Union Ave
- 876 Dry Creek Rd
- 513 Union Ave
- 511 Union Ave
- 523 Union Ave
- 515 Union Ave
- 120 Kennedy Ave
- 2433 New Jersey Ave
- 195 Sunnyside Ave
- 1162 Erin Way
- 1190 Erin Way
- 1156 Erin Way
- 1200 Erin Way
- 1161 Normandy Dr
- 1185 Normandy Dr
- 1151 Normandy Dr
- 1179 Erin Way
- 1197 Normandy Dr
- 1142 Erin Way
- 1206 Erin Way
- 1236 Shamrock Dr
- 1135 Normandy Dr
- 1153 Erin Way
- 1205 Normandy Dr
- 1132 Erin Way
- 1141 Erin Way
- 1123 Normandy Dr
- 1206 Shamrock Dr
- 1133 Erin Way