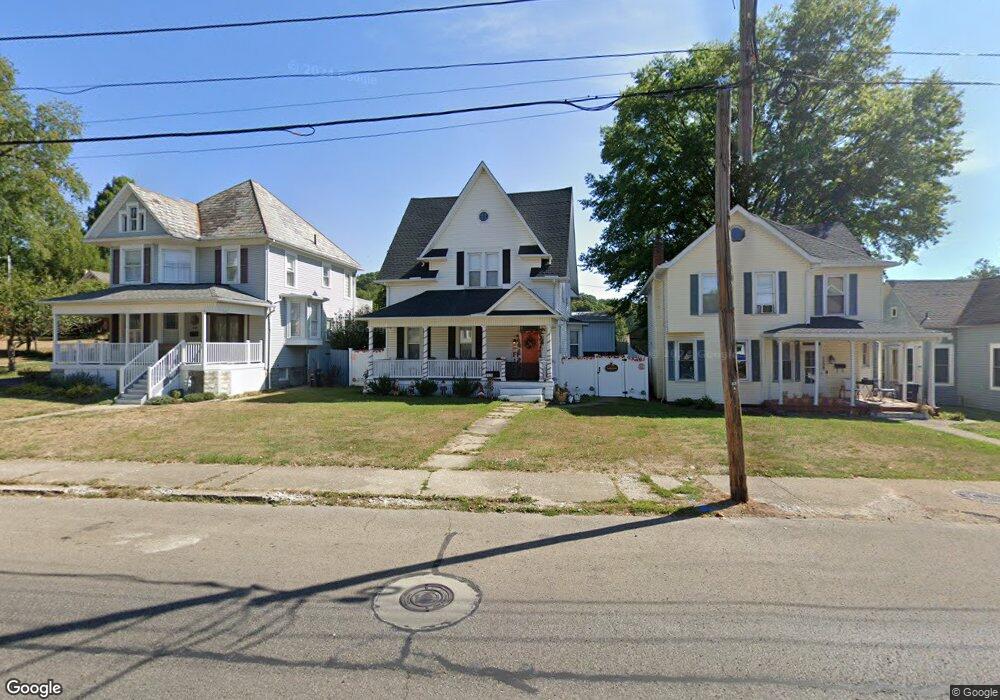
1176 N Columbus St Lancaster, OH 43130
Estimated Value: $239,000 - $292,000
4
Beds
2
Baths
1,883
Sq Ft
$144/Sq Ft
Est. Value
About This Home
This home is located at 1176 N Columbus St, Lancaster, OH 43130 and is currently estimated at $272,026, approximately $144 per square foot. 1176 N Columbus St is a home located in Fairfield County with nearby schools including Tarhe Elementary School, General Sherman Junior High School, and Lancaster High School.
Ownership History
Date
Name
Owned For
Owner Type
Purchase Details
Closed on
Nov 20, 2020
Sold by
Frf2 Llc
Bought by
Douglas Dillon and Douglas Meredith
Current Estimated Value
Home Financials for this Owner
Home Financials are based on the most recent Mortgage that was taken out on this home.
Original Mortgage
$194,370
Outstanding Balance
$172,567
Interest Rate
2.8%
Mortgage Type
VA
Estimated Equity
$99,459
Purchase Details
Closed on
May 12, 2020
Sold by
Fairfield Federal Savings And Loan Assoc
Bought by
Frf2 Llc
Purchase Details
Closed on
Jan 27, 2020
Sold by
Anders David A and Tax Ease Ohio Llc
Bought by
Fairfield Fsla Of Lancaster
Purchase Details
Closed on
Jan 30, 1998
Sold by
Est Carole L Alley
Bought by
Anders David A
Home Financials for this Owner
Home Financials are based on the most recent Mortgage that was taken out on this home.
Original Mortgage
$70,000
Interest Rate
7.16%
Mortgage Type
New Conventional
Create a Home Valuation Report for This Property
The Home Valuation Report is an in-depth analysis detailing your home's value as well as a comparison with similar homes in the area
Home Values in the Area
Average Home Value in this Area
Purchase History
| Date | Buyer | Sale Price | Title Company |
|---|---|---|---|
| Douglas Dillon | $190,000 | Hocking Valley Ttl Agcy Inc | |
| Frf2 Llc | $280,000 | None Listed On Document | |
| Fairfield Fsla Of Lancaster | $66,000 | None Available | |
| Anders David A | $70,000 | -- |
Source: Public Records
Mortgage History
| Date | Status | Borrower | Loan Amount |
|---|---|---|---|
| Open | Douglas Dillon | $194,370 | |
| Previous Owner | Anders David A | $70,000 |
Source: Public Records
Tax History Compared to Growth
Tax History
| Year | Tax Paid | Tax Assessment Tax Assessment Total Assessment is a certain percentage of the fair market value that is determined by local assessors to be the total taxable value of land and additions on the property. | Land | Improvement |
|---|---|---|---|---|
| 2024 | $5,978 | $66,500 | $13,990 | $52,510 |
| 2023 | $2,419 | $66,500 | $13,990 | $52,510 |
| 2022 | $2,428 | $66,500 | $13,990 | $52,510 |
| 2021 | $2,276 | $58,330 | $11,660 | $46,670 |
| 2020 | $2,266 | $56,520 | $11,660 | $44,860 |
| 2019 | $2,010 | $56,520 | $11,660 | $44,860 |
| 2018 | $1,728 | $44,450 | $11,660 | $32,790 |
| 2017 | $1,728 | $46,160 | $13,600 | $32,560 |
| 2016 | $1,683 | $46,160 | $13,600 | $32,560 |
| 2015 | $1,683 | $44,790 | $13,600 | $31,190 |
| 2014 | $1,603 | $44,790 | $13,600 | $31,190 |
| 2013 | $1,603 | $44,790 | $13,600 | $31,190 |
Source: Public Records
Map
Nearby Homes
- 1190 N Columbus St
- 100 Wilson Ave
- 222 Park St
- 315 Park St
- 1318 Graf St
- 0 Marks Ave Unit 225036443
- 603 Edgewood Ave
- 806 N High St
- 1511 N Columbus St
- 1000 Goodwin Ave
- 220 E Fair Ave
- 711 N High St
- 230 Lake St
- 0 Wacker Dr Unit 225036189
- 526 N Columbus St
- 708 N High St
- 936 Harrison Ave
- 515 N Columbus St
- 311 E Allen St
- 844 Washington Ave
- 1178 N Columbus St
- 1158 N Columbus St
- 1156 N Columbus St
- 1152 N Columbus St
- 1152 N Columbus St Unit 2
- 1180 N Columbus St
- 1180 N Columbus St
- 1150 N Columbus St
- 1171 N Columbus St
- 1153 N Columbus St
- 191 Davis St
- 1148 N Columbus St
- 1173 N Columbus St
- 1175 N Columbus St
- 193 Davis St
- 1141 N Columbus St
- 1177 N Columbus St
- 212 Edgewood Ave
- 1186 N Columbus St
- 217 Edgewood Ave