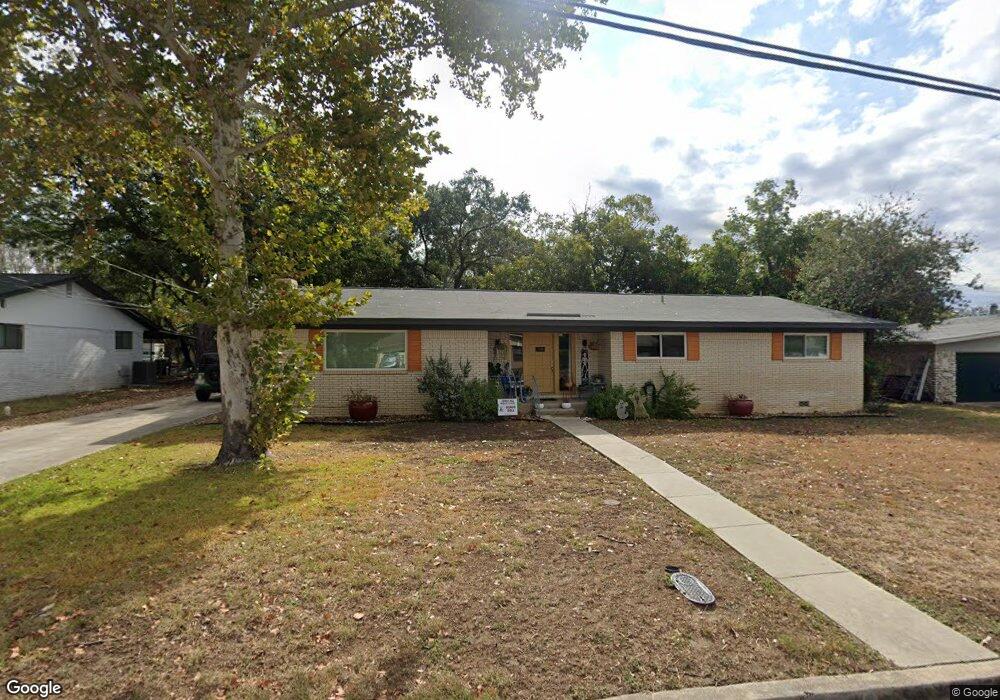
1176 Rivercrest Dr New Braunfels, TX 78130
Estimated Value: $380,000 - $500,000
4
Beds
2
Baths
2,360
Sq Ft
$192/Sq Ft
Est. Value
About This Home
This home is located at 1176 Rivercrest Dr, New Braunfels, TX 78130 and is currently estimated at $452,292, approximately $191 per square foot. 1176 Rivercrest Dr is a home located in Comal County with nearby schools including Goodwin Frazier Elementary School, Church Hill Middle School, and Cross Lutheran School.
Ownership History
Date
Name
Owned For
Owner Type
Purchase Details
Closed on
Jan 4, 2017
Sold by
Moody Cecil
Bought by
Preston Jason and Preston Katie R
Current Estimated Value
Home Financials for this Owner
Home Financials are based on the most recent Mortgage that was taken out on this home.
Original Mortgage
$213,200
Outstanding Balance
$175,243
Interest Rate
4.03%
Mortgage Type
New Conventional
Estimated Equity
$277,049
Purchase Details
Closed on
Oct 1, 2016
Sold by
Sparks Karen Leigh and Gionzalez Arnold Jodi Marie
Bought by
Moody Cecil
Home Financials for this Owner
Home Financials are based on the most recent Mortgage that was taken out on this home.
Original Mortgage
$40,000
Interest Rate
3.46%
Mortgage Type
Purchase Money Mortgage
Purchase Details
Closed on
Oct 27, 2010
Sold by
Miller Donald L and Miller Marguerite
Bought by
Moody Cecil and Moody Elizabeth
Create a Home Valuation Report for This Property
The Home Valuation Report is an in-depth analysis detailing your home's value as well as a comparison with similar homes in the area
Home Values in the Area
Average Home Value in this Area
Purchase History
| Date | Buyer | Sale Price | Title Company |
|---|---|---|---|
| Preston Jason | -- | Capital Title | |
| Moody Cecil | -- | New Braunfels Title Co | |
| Moody Cecil | -- | Independence Title Company |
Source: Public Records
Mortgage History
| Date | Status | Borrower | Loan Amount |
|---|---|---|---|
| Open | Preston Jason | $213,200 | |
| Previous Owner | Moody Cecil | $40,000 |
Source: Public Records
Tax History Compared to Growth
Tax History
| Year | Tax Paid | Tax Assessment Tax Assessment Total Assessment is a certain percentage of the fair market value that is determined by local assessors to be the total taxable value of land and additions on the property. | Land | Improvement |
|---|---|---|---|---|
| 2025 | $4,070 | $402,937 | -- | -- |
| 2024 | $4,070 | $366,306 | $100,810 | $265,496 |
| 2023 | $4,070 | $388,665 | $0 | $0 |
| 2022 | $4,838 | $353,332 | -- | -- |
| 2021 | $6,801 | $327,210 | $77,540 | $249,670 |
| 2020 | $6,384 | $292,010 | $49,880 | $242,130 |
| 2019 | $6,555 | $293,130 | $32,850 | $260,280 |
| 2018 | $6,117 | $273,530 | $32,850 | $240,680 |
| 2017 | $5,744 | $257,430 | $32,850 | $224,580 |
| 2016 | $4,891 | $219,230 | $32,850 | $186,380 |
| 2015 | $4,228 | $197,580 | $32,850 | $164,730 |
| 2014 | $4,228 | $189,500 | $32,850 | $156,650 |
Source: Public Records
Map
Nearby Homes
- 1106 Hillcrest Dr
- 1174 Mooncrest
- 1232 Rivercrest Dr
- 1236 Rivercrest Dr
- 868 Farmhouse Trail
- 962 River Terrace
- 1236 Tuscan View
- 893 Farmhouse Trail
- 893 Casetta Trail
- 1229 Casetta Run
- 1231 Casetta Run
- 832 Albert St
- 266 Rolling Hills
- 616 Ridgecrest
- 664 E North St
- 773 Albert St
- 1049 River Terrace
- 1267 E Common St
- 695 Albert St
- 683 Albert St
- 1164 Rivercrest Dr
- 1188 Rivercrest Dr
- 1173 Hillcrest Dr
- 1185 Hillcrest Dr
- 1159 Hillcrest Dr
- 1152 Rivercrest Dr
- 1175 Rivercrest Dr
- 1163 Rivercrest Dr
- 1187 Rivercrest Dr
- 1147 Hillcrest Dr
- 711 Fire Wheel
- 715 Fire Wheel
- 740 Fair Ln
- 1151 Rivercrest Dr
- 1140 Rivercrest Dr
- 730 Fair Ln
- 1203 Rivercrest Dr
- 908 River Terrace
- 910 River Terrace
- 910 River Terrace Unit A