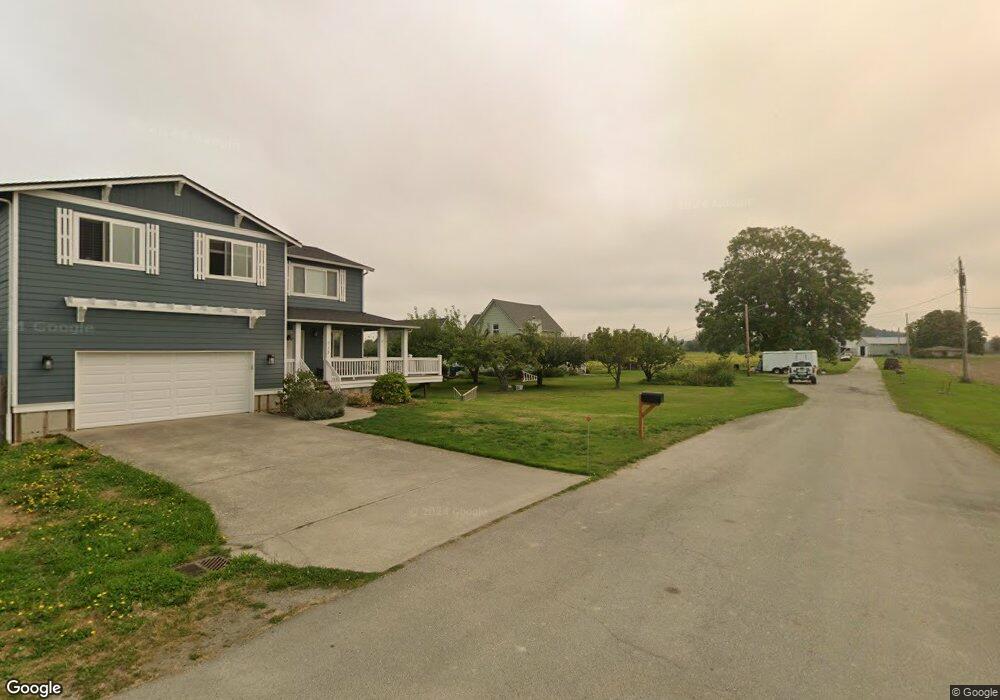
11767 E Caledonia St La Conner, WA 98257
Estimated Value: $662,000 - $699,240
3
Beds
3
Baths
2,264
Sq Ft
$300/Sq Ft
Est. Value
About This Home
This home is located at 11767 E Caledonia St, La Conner, WA 98257 and is currently estimated at $679,810, approximately $300 per square foot. 11767 E Caledonia St is a home located in Skagit County with nearby schools including La Conner Elementary School and La Conner Middle and High Schools.
Ownership History
Date
Name
Owned For
Owner Type
Purchase Details
Closed on
Mar 21, 2019
Sold by
Martin Susan M and Cram Herbert S
Bought by
Ritchie Catherine D and Phillips Stephen M
Current Estimated Value
Home Financials for this Owner
Home Financials are based on the most recent Mortgage that was taken out on this home.
Original Mortgage
$380,000
Outstanding Balance
$332,718
Interest Rate
4.3%
Mortgage Type
New Conventional
Estimated Equity
$347,092
Purchase Details
Closed on
Dec 21, 2018
Sold by
Martin Susan M and Cram Herbert S
Bought by
Martin Susan M and Cram Herbert S
Purchase Details
Closed on
Feb 14, 2011
Sold by
Cram Jean E and Estate Of Sam D Cram
Bought by
Cram Jean E
Create a Home Valuation Report for This Property
The Home Valuation Report is an in-depth analysis detailing your home's value as well as a comparison with similar homes in the area
Purchase History
| Date | Buyer | Sale Price | Title Company |
|---|---|---|---|
| Ritchie Catherine D | $400,000 | Chicago Title | |
| Martin Susan M | -- | None Available | |
| Cram Jean E | -- | None Available |
Source: Public Records
Mortgage History
| Date | Status | Borrower | Loan Amount |
|---|---|---|---|
| Open | Ritchie Catherine D | $380,000 |
Source: Public Records
Tax History
| Year | Tax Paid | Tax Assessment Tax Assessment Total Assessment is a certain percentage of the fair market value that is determined by local assessors to be the total taxable value of land and additions on the property. | Land | Improvement |
|---|---|---|---|---|
| 2025 | $5,047 | $627,900 | $369,200 | $258,700 |
| 2024 | $5,029 | $560,600 | $345,000 | $215,600 |
| 2023 | $5,029 | $560,600 | $345,000 | $215,600 |
| 2022 | $4,913 | $594,700 | $340,500 | $254,200 |
| 2021 | $4,811 | $464,700 | $243,000 | $221,700 |
| 2020 | $4,511 | $411,200 | $0 | $0 |
| 2019 | $3,972 | $371,500 | $0 | $0 |
| 2018 | $4,027 | $331,400 | $0 | $0 |
| 2017 | $3,704 | $295,600 | $0 | $0 |
| 2016 | $3,607 | $286,100 | $127,600 | $158,500 |
| 2015 | $3,628 | $244,200 | $101,500 | $142,700 |
| 2013 | $3,396 | $244,200 | $0 | $0 |
Source: Public Records
Map
Nearby Homes
- 733 Maple Ave
- 607 Maple Ave Unit A-D
- 705 Finley Ln Unit N2
- 220 Morris St
- 306 Centre St Unit B
- 306 Centre St Unit A
- 307 Centre St
- 623 E Morris St Unit E-1
- 623 E Morris St Unit E2
- 106 Chinook Place
- 159 Swinomish Dr
- 858 Kalispell Dr
- 193 Salish Place
- 200 Swinomish Dr
- 880 Shoshone Dr
- 102 Shelter Bay Dr
- 314 Snohomish Dr
- 476 Nez Perce Place
- 523 Kloshe Way
- 350 Stillaguamish Place
Your Personal Tour Guide
Ask me questions while you tour the home.