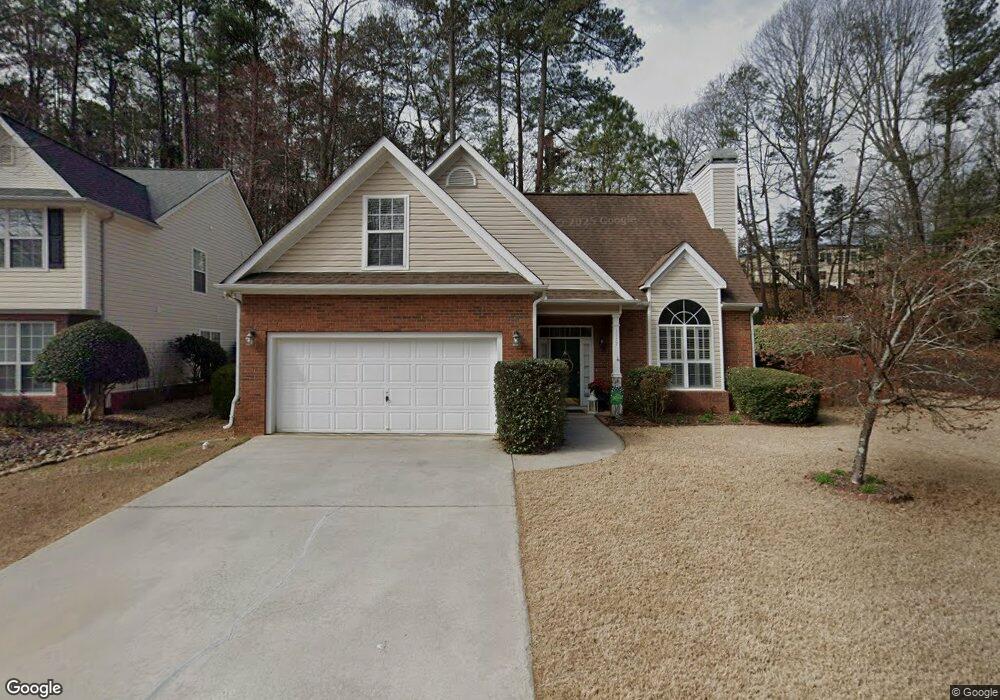
1177 Rhyne Chase SE Smyrna, GA 30082
Estimated Value: $478,000 - $538,000
4
Beds
3
Baths
2,207
Sq Ft
$232/Sq Ft
Est. Value
About This Home
This home is located at 1177 Rhyne Chase SE, Smyrna, GA 30082 and is currently estimated at $511,609, approximately $231 per square foot. 1177 Rhyne Chase SE is a home located in Cobb County with nearby schools including King Springs Elementary School, Griffin Middle School, and Campbell High School.
Ownership History
Date
Name
Owned For
Owner Type
Purchase Details
Closed on
May 27, 2020
Sold by
Battaglia Anthony A
Bought by
Battaglia Anthony A and Battaglia Caroline E
Current Estimated Value
Purchase Details
Closed on
May 31, 2019
Sold by
Battaglia Caroline E
Bought by
Battaglia Anthony A
Home Financials for this Owner
Home Financials are based on the most recent Mortgage that was taken out on this home.
Original Mortgage
$280,000
Outstanding Balance
$245,677
Interest Rate
4.1%
Mortgage Type
New Conventional
Estimated Equity
$265,932
Purchase Details
Closed on
Oct 28, 2002
Sold by
Bushulen Billy and Bushulen Dale W
Bought by
Battaglia Anthony A and Battaglia Caroline E
Home Financials for this Owner
Home Financials are based on the most recent Mortgage that was taken out on this home.
Original Mortgage
$165,600
Interest Rate
3.88%
Mortgage Type
New Conventional
Purchase Details
Closed on
Oct 23, 1997
Sold by
Knight Davidson Companies Inc
Bought by
Bushulen Billy and Bushulen Dale W
Create a Home Valuation Report for This Property
The Home Valuation Report is an in-depth analysis detailing your home's value as well as a comparison with similar homes in the area
Home Values in the Area
Average Home Value in this Area
Purchase History
| Date | Buyer | Sale Price | Title Company |
|---|---|---|---|
| Battaglia Anthony A | -- | None Available | |
| Battaglia Anthony A | -- | None Available | |
| Battaglia Anthony A | -- | -- | |
| Battaglia Anthony A | $207,000 | -- | |
| Bushulen Billy | $161,000 | -- |
Source: Public Records
Mortgage History
| Date | Status | Borrower | Loan Amount |
|---|---|---|---|
| Open | Battaglia Anthony A | $280,000 | |
| Previous Owner | Battaglia Anthony A | $165,600 |
Source: Public Records
Tax History Compared to Growth
Tax History
| Year | Tax Paid | Tax Assessment Tax Assessment Total Assessment is a certain percentage of the fair market value that is determined by local assessors to be the total taxable value of land and additions on the property. | Land | Improvement |
|---|---|---|---|---|
| 2025 | $4,072 | $196,316 | $38,000 | $158,316 |
| 2024 | $3,638 | $173,092 | $48,000 | $125,092 |
| 2023 | $3,149 | $173,092 | $48,000 | $125,092 |
| 2022 | $3,188 | $147,556 | $30,000 | $117,556 |
| 2021 | $2,717 | $121,820 | $30,000 | $91,820 |
| 2020 | $2,717 | $121,820 | $30,000 | $91,820 |
| 2019 | $2,717 | $121,820 | $30,000 | $91,820 |
| 2018 | $2,717 | $121,820 | $30,000 | $91,820 |
| 2017 | $2,289 | $105,536 | $30,000 | $75,536 |
| 2016 | $2,293 | $105,536 | $30,000 | $75,536 |
| 2015 | $2,129 | $94,584 | $30,000 | $64,584 |
| 2014 | $1,942 | $83,924 | $0 | $0 |
Source: Public Records
Map
Nearby Homes
- 204 Kenninghall Ln SE Unit 6
- 904 Bridge Ln SE
- 1212 Stone Castle Cir SE
- 502 Bridge Ln SE
- 505 Bridge Ln SE
- 606 Mill Pond Dr SE
- 609 Mill Pond Dr SE
- 610 Mill Pond Dr SE
- 303 Mill Pond Ct SE
- 2158 Berryhill Cir SE
- 937 Hidden Falls Ln SE
- 4368 Laurel Cir SE
- 4381 King Valley Dr SE
- 931 Hidden Falls Ln SE
- 4398 King Valley 3-5 Dr SE
- 4201 Charleston Trail SE
- 1241 Kingsview Dr SE
- 3755 Ashwood Dr SE
- 1554 Cooper Lake Rd SE
- 5033 David Place SE
- 1175 Rhyne Chase SE
- 1173 Rhyne Chase SE
- 1172 Rhyne Chase SE
- 1171 Rhyne Chase SE
- 1170 Rhyne Chase SE
- 1168 Rhyne Chase SE
- 3950 Rhyne Way SE
- 0 Rhyne Chase Unit 7278590
- 0 Rhyne Chase
- 1166 Rhyne Chase SE
- 1164 Rhyne Chase SE
- 1165 Rhyne Chase SE
- 3955 Rhyne Way SE
- 1162 Rhyne Chase SE
- 1160 Rhyne Chase SE
- 1161 Rhyne Chase SE
- 1712 Hidden Springs Trace SE
- 1158 Rhyne Chase SE
- 1708 Hidden Springs Trace SE
- 1159 Rhyne Chase SE