Y
Seller's Agent in 2016
Yang Kong
T L C Real Estate Group
(562) 818-8753
3 in this area
13 Total Sales
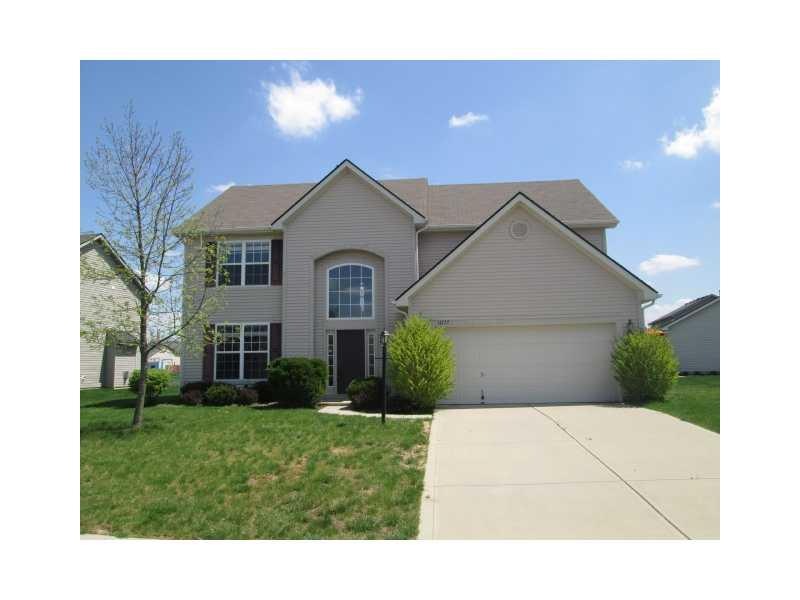
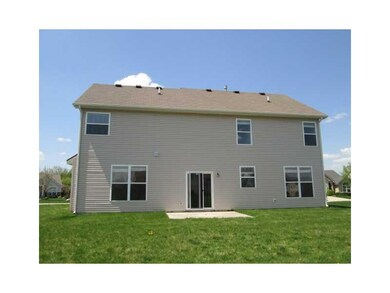
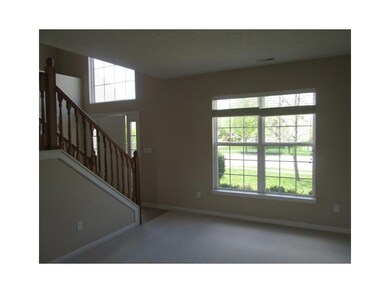
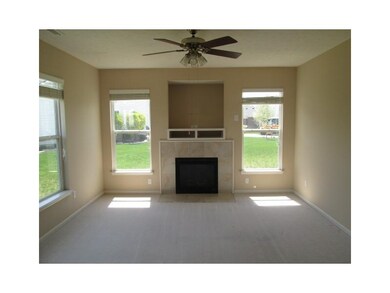
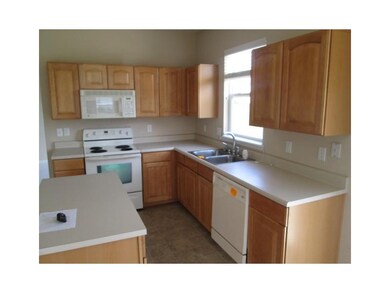
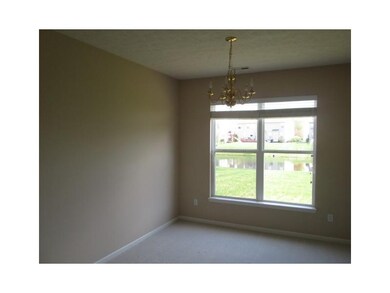
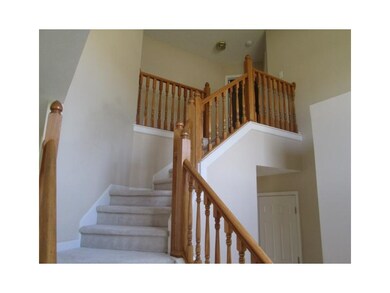
Royalwood neighborhood in fabulous Fishers! Live where everyone else wants to; walking trails, pool, playground and near schools and shopping. This well maintained 4 bedroom, 2.5 bath features a peaceful pond view and a cozy familyroom with fireplace along with over 2200 square feet of living space. Your friends and family can gather in the family room and you will not miss out on a thing while you prepare refreshments in the kitchenof this open concept home~! The majestic staircase, the fire
Last Agent to Sell the Property
Wilmoth Group License #RB14030996 Listed on: 05/07/2013
Last Buyer's Agent
Phillip Wang
T L C Real Estate Group
| Date | Type | Sale Price | Title Company |
|---|---|---|---|
| Warranty Deed | -- | Chicago Title Co Llc | |
| Special Warranty Deed | -- | None Available | |
| Sheriffs Deed | $137,100 | None Available | |
| Warranty Deed | -- | -- |
| Date | Status | Loan Amount | Loan Type |
|---|---|---|---|
| Closed | $186,200 | New Conventional | |
| Closed | $186,200 | New Conventional | |
| Closed | $198,341 | FHA | |
| Previous Owner | $158,526 | FHA | |
| Previous Owner | $174,950 | Purchase Money Mortgage |
| Date | Event | Price | Change | Sq Ft Price |
|---|---|---|---|---|
| 05/27/2016 05/27/16 | Sold | $202,000 | -6.9% | $92 / Sq Ft |
| 04/16/2016 04/16/16 | Pending | -- | -- | -- |
| 03/30/2016 03/30/16 | Price Changed | $217,000 | -3.6% | $98 / Sq Ft |
| 10/30/2015 10/30/15 | Price Changed | $225,000 | -4.3% | $102 / Sq Ft |
| 10/05/2015 10/05/15 | Price Changed | $235,000 | -1.7% | $107 / Sq Ft |
| 09/10/2015 09/10/15 | For Sale | $239,000 | +44.8% | $108 / Sq Ft |
| 08/06/2013 08/06/13 | Sold | $165,000 | -2.9% | $75 / Sq Ft |
| 05/20/2013 05/20/13 | Pending | -- | -- | -- |
| 05/07/2013 05/07/13 | For Sale | $169,900 | -- | $77 / Sq Ft |
| Year | Tax Paid | Tax Assessment Tax Assessment Total Assessment is a certain percentage of the fair market value that is determined by local assessors to be the total taxable value of land and additions on the property. | Land | Improvement |
|---|---|---|---|---|
| 2024 | $3,001 | $302,600 | $54,000 | $248,600 |
| 2023 | $3,001 | $278,800 | $54,000 | $224,800 |
| 2022 | $3,025 | $256,400 | $54,000 | $202,400 |
| 2021 | $2,734 | $230,600 | $68,000 | $162,600 |
| 2020 | $2,542 | $220,200 | $68,000 | $152,200 |
| 2019 | $2,387 | $209,000 | $45,000 | $164,000 |
| 2018 | $2,152 | $193,300 | $45,000 | $148,300 |
| 2017 | $2,024 | $186,300 | $45,000 | $141,300 |
| 2016 | $1,927 | $180,500 | $45,000 | $135,500 |
| 2014 | $1,766 | $176,900 | $45,000 | $131,900 |
| 2013 | $1,766 | $168,200 | $45,000 | $123,200 |
Y
Seller's Agent in 2016
Yang Kong
T L C Real Estate Group
(562) 818-8753
3 in this area
13 Total Sales
T
Buyer's Agent in 2016
Toby Smith
Compass Indiana, LLC

Seller's Agent in 2013
Jennifer Wilmoth
Wilmoth Group
(239) 233-4586
140 Total Sales
P
Buyer's Agent in 2013
Phillip Wang
T L C Real Estate Group
Source: MIBOR Broker Listing Cooperative®
MLS Number: 21230633
APN: 29-11-36-008-029.000-020
Disclaimer: Certain information contained herein is derived from information provided by parties other than Homes.com. All information provided is deemed reliable, but is not guaranteed to be accurate and should be independently verified.
![]() Based on information submitted to the MLS GRID. All data is obtained from various sources and may not have been verified by broker or MLS GRID. Supplied Open House Information is subject to change without notice. All information should be independently reviewed and verified for accuracy. Properties may or may not be listed by the office/agent presenting the information. Some IDX listings have been excluded from this website.
Based on information submitted to the MLS GRID. All data is obtained from various sources and may not have been verified by broker or MLS GRID. Supplied Open House Information is subject to change without notice. All information should be independently reviewed and verified for accuracy. Properties may or may not be listed by the office/agent presenting the information. Some IDX listings have been excluded from this website.