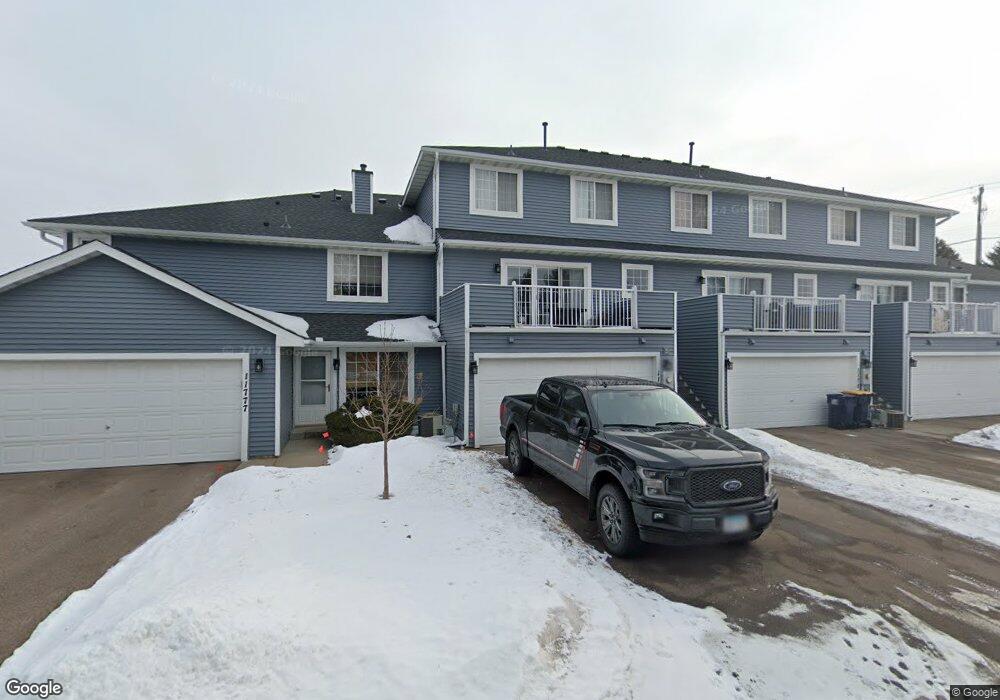
11779 Millpond Ave Unit 105 Burnsville, MN 55337
Estimated Value: $244,000 - $247,876
2
Beds
2
Baths
1,837
Sq Ft
$134/Sq Ft
Est. Value
About This Home
This home is located at 11779 Millpond Ave Unit 105, Burnsville, MN 55337 and is currently estimated at $245,719, approximately $133 per square foot. 11779 Millpond Ave Unit 105 is a home located in Dakota County with nearby schools including Burnsville High School, Gateway STEM Academy, and Sunrise International Montessori School.
Ownership History
Date
Name
Owned For
Owner Type
Purchase Details
Closed on
Jul 16, 2025
Sold by
State Of Minnesota
Bought by
City Of Burnsville
Current Estimated Value
Purchase Details
Closed on
Dec 12, 2019
Sold by
Flannery Cody M
Bought by
Straight Chase and Straight Alexa
Home Financials for this Owner
Home Financials are based on the most recent Mortgage that was taken out on this home.
Original Mortgage
$183,052
Interest Rate
3.6%
Mortgage Type
VA
Purchase Details
Closed on
Sep 26, 2001
Sold by
Ryan Ronda A
Bought by
Flannery Perry M
Purchase Details
Closed on
Oct 3, 2000
Sold by
Quinn Jean R
Bought by
Ryan Ronda A
Purchase Details
Closed on
May 15, 1998
Sold by
Finke Development And Investment Group
Bought by
Delta Development Inc
Create a Home Valuation Report for This Property
The Home Valuation Report is an in-depth analysis detailing your home's value as well as a comparison with similar homes in the area
Home Values in the Area
Average Home Value in this Area
Purchase History
| Date | Buyer | Sale Price | Title Company |
|---|---|---|---|
| City Of Burnsville | -- | None Listed On Document | |
| Straight Chase | $179,200 | Lake Title Llc | |
| Flannery Perry M | $147,000 | -- | |
| Ryan Ronda A | $115,000 | -- | |
| Delta Development Inc | $5,000 | -- |
Source: Public Records
Mortgage History
| Date | Status | Borrower | Loan Amount |
|---|---|---|---|
| Previous Owner | Straight Chase | $183,052 |
Source: Public Records
Tax History Compared to Growth
Tax History
| Year | Tax Paid | Tax Assessment Tax Assessment Total Assessment is a certain percentage of the fair market value that is determined by local assessors to be the total taxable value of land and additions on the property. | Land | Improvement |
|---|---|---|---|---|
| 2024 | $2,142 | $202,700 | $37,000 | $165,700 |
| 2023 | $2,142 | $217,300 | $37,100 | $180,200 |
| 2022 | $1,846 | $200,000 | $37,000 | $163,000 |
| 2021 | $1,744 | $188,100 | $32,200 | $155,900 |
| 2020 | $1,620 | $171,100 | $30,700 | $140,400 |
| 2019 | $1,630 | $155,800 | $29,200 | $126,600 |
| 2018 | $1,524 | $150,100 | $27,000 | $123,100 |
| 2017 | $1,486 | $138,400 | $25,000 | $113,400 |
| 2016 | $1,449 | $134,300 | $23,800 | $110,500 |
| 2015 | $1,282 | $101,626 | $18,427 | $83,199 |
| 2014 | -- | $93,015 | $16,891 | $76,124 |
| 2013 | -- | $82,333 | $14,485 | $67,848 |
Source: Public Records
Map
Nearby Homes
- 2200 Horizon Rd
- 11900 Highland View Cir
- 1853 Riverwood Dr Unit 4
- 1800 Riverwood Dr Unit 110
- 1800 Riverwood Dr Unit 323
- 11921 Baypoint Dr
- 11902 River Hills Cir
- 3017 Mcleod St
- 1609 Riverwood Dr
- 2329 Explorer Ct
- 11311 W River Hills Dr
- 2005 E 122nd St Unit A7
- 2005 E 122nd St Unit A14
- 2005 E 122nd St Unit A23
- 2011 E 122nd St Unit D24
- 2009 E 122nd St Unit C8
- 12232 Oak Leaf Cir
- 2007 E 122nd St Unit B15
- 1601 Raleigh Dr
- 2001 Woods Ln
- 11781 Millpond Ave Unit 104
- 11777 Millpond Ave Unit 106
- 11783 Millpond Ave Unit 103
- 11785 Millpond Ave
- 11769 Millpond Ave Unit 98
- 11767 Millpond Ave
- 11755 Millpond Ave
- 11755 Millpond Ave Unit 91
- 11753 Millpond Ave Unit 90
- 11765 Millpond Ave Unit 92
- 11763 Millpond Ave
- 11751 Millpond Ave
- 11751 Millpond Ave Unit 89
- 11761 Millpond Ave
- 11759 Millpond Ave Unit 95
- 11747 Millpond Ave
- 11747 Millpond Ave Unit 87
- 11749 Millpond Ave Unit 88
- 11757 Millpond Ave
- 11851 Millpond Ave