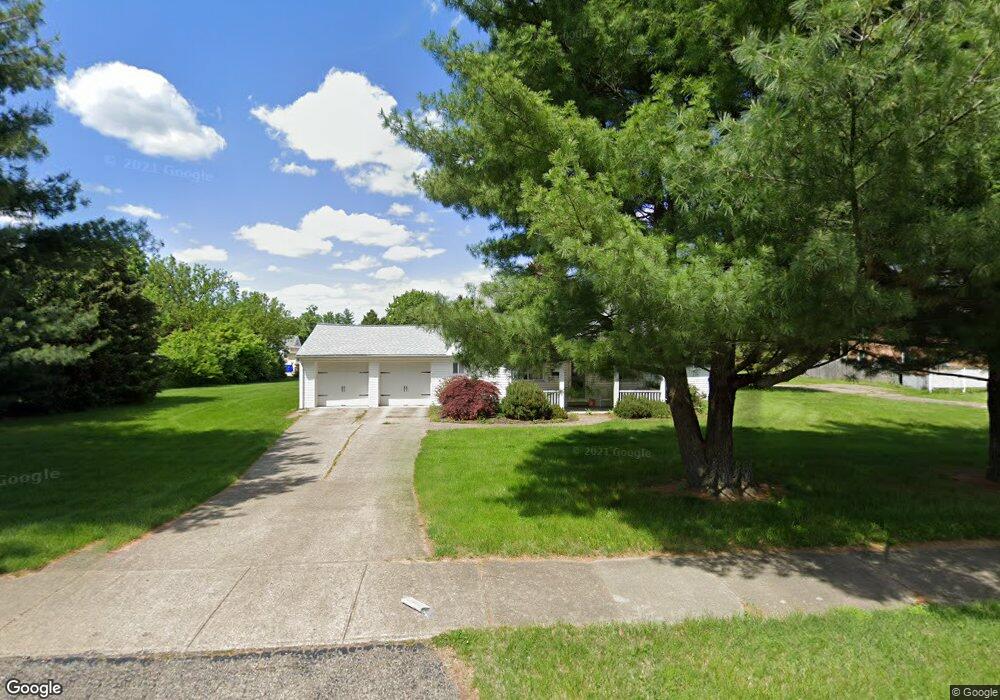
1178 Bishop Ave Hamilton, OH 45015
East Hamilton NeighborhoodEstimated Value: $232,000 - $279,000
3
Beds
2
Baths
1,591
Sq Ft
$164/Sq Ft
Est. Value
About This Home
This home is located at 1178 Bishop Ave, Hamilton, OH 45015 and is currently estimated at $261,367, approximately $164 per square foot. 1178 Bishop Ave is a home located in Butler County with nearby schools including Linden Elementary School, Garfield Middle School, and Hamilton Freshman School.
Ownership History
Date
Name
Owned For
Owner Type
Purchase Details
Closed on
Jun 3, 2011
Sold by
Kennedy Dorothy H
Bought by
Smith Dustin L and Reynolds Heather D
Current Estimated Value
Home Financials for this Owner
Home Financials are based on the most recent Mortgage that was taken out on this home.
Original Mortgage
$92,000
Outstanding Balance
$63,927
Interest Rate
4.8%
Mortgage Type
New Conventional
Estimated Equity
$197,440
Purchase Details
Closed on
Feb 10, 2010
Sold by
The Bank Of New York Mellon
Bought by
Kennedy Dorothy H
Purchase Details
Closed on
Sep 30, 2009
Sold by
Robertson Ricky
Bought by
The Bank Of New York
Purchase Details
Closed on
Apr 7, 2006
Sold by
Keene Robert J
Bought by
Robertson Ricky and Vandergraft Angel M
Home Financials for this Owner
Home Financials are based on the most recent Mortgage that was taken out on this home.
Original Mortgage
$76,000
Interest Rate
6.74%
Mortgage Type
Fannie Mae Freddie Mac
Create a Home Valuation Report for This Property
The Home Valuation Report is an in-depth analysis detailing your home's value as well as a comparison with similar homes in the area
Home Values in the Area
Average Home Value in this Area
Purchase History
| Date | Buyer | Sale Price | Title Company |
|---|---|---|---|
| Smith Dustin L | $97,900 | Prominent Title Agency Llc | |
| Kennedy Dorothy H | $39,900 | Attorney | |
| The Bank Of New York | $55,000 | None Available | |
| Robertson Ricky | $95,000 | Royal Land Title Agency Ltd |
Source: Public Records
Mortgage History
| Date | Status | Borrower | Loan Amount |
|---|---|---|---|
| Open | Smith Dustin L | $92,000 | |
| Previous Owner | Robertson Ricky | $76,000 |
Source: Public Records
Tax History Compared to Growth
Tax History
| Year | Tax Paid | Tax Assessment Tax Assessment Total Assessment is a certain percentage of the fair market value that is determined by local assessors to be the total taxable value of land and additions on the property. | Land | Improvement |
|---|---|---|---|---|
| 2024 | $3,193 | $75,670 | $17,270 | $58,400 |
| 2023 | $3,179 | $75,670 | $17,270 | $58,400 |
| 2022 | $2,682 | $56,800 | $17,270 | $39,530 |
| 2021 | $2,497 | $55,130 | $17,270 | $37,860 |
| 2020 | $2,601 | $55,130 | $17,270 | $37,860 |
| 2019 | $3,220 | $43,980 | $15,860 | $28,120 |
| 2018 | $2,045 | $43,980 | $15,860 | $28,120 |
| 2017 | $2,062 | $43,980 | $15,860 | $28,120 |
| 2016 | $2,002 | $40,680 | $15,860 | $24,820 |
| 2015 | $1,991 | $40,680 | $15,860 | $24,820 |
| 2014 | $1,575 | $40,680 | $15,860 | $24,820 |
| 2013 | $1,575 | $34,270 | $15,860 | $18,410 |
Source: Public Records
Map
Nearby Homes
- 3910 Kenwood Dr
- 85 Dayspring Dr
- 1087 Hayes Ave
- 4095 Kenwood Dr
- 0 Dixie Hwy
- 901 Allen Ave
- 1101 Chase Ave
- 22 Meadowview Ct
- 875 Symmes Rd
- 1036 Chase Ave
- 800 Saint Clair Ave
- 855 Chase Ave
- 3510 Benninghofen Ave
- 4701 Fairfield Ave
- 4716 Fairfield Ave
- 715 Corwin Ave
- 940 Hooven Ave
- 4638 Celadon Ave
- 921 Weller Ave
- 714 Clinton Ave
- 1168 Bishop Ave
- 1177 Saint Clair Ave
- 1181 Saint Clair Ave
- 1162 Bishop Ave
- 1175 Bishop Ave
- 1181 Bishop Ave
- 1171 Bishop Ave
- 1163 Saint Clair Ave
- 1187 Bishop Ave
- 1158 Bishop Ave
- 1167 Bishop Ave
- 1163 St Clair Ave
- 1163 Bishop Ave
- 3825 Dixie Hwy
- 3825 Dixie Hwy
- 1193 Bishop Ave
- 1159 Saint Clair Ave
- 1154 Bishop Ave
- 1159 Bishop Ave
- 1159 St Clair Ave