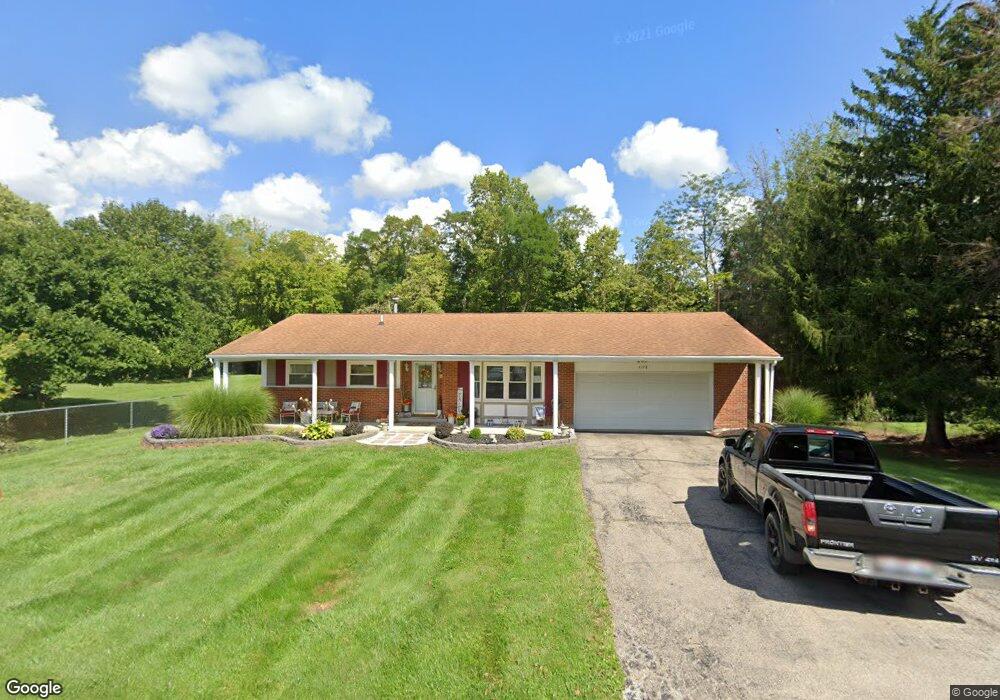
1178 Brush Row Rd Wilberforce, OH 45384
Estimated Value: $193,000 - $245,000
4
Beds
2
Baths
1,096
Sq Ft
$190/Sq Ft
Est. Value
About This Home
This home is located at 1178 Brush Row Rd, Wilberforce, OH 45384 and is currently estimated at $208,468, approximately $190 per square foot. 1178 Brush Row Rd is a home with nearby schools including Xenia High School.
Ownership History
Date
Name
Owned For
Owner Type
Purchase Details
Closed on
Sep 29, 2000
Sold by
Judy Thomas
Bought by
Webb Darrin A and Webb Tracy L
Current Estimated Value
Home Financials for this Owner
Home Financials are based on the most recent Mortgage that was taken out on this home.
Original Mortgage
$82,000
Outstanding Balance
$32,871
Interest Rate
10.62%
Estimated Equity
$175,597
Purchase Details
Closed on
Nov 18, 1997
Sold by
Kinney Marilyn J
Bought by
Thomas Judy
Home Financials for this Owner
Home Financials are based on the most recent Mortgage that was taken out on this home.
Original Mortgage
$93,800
Interest Rate
7.43%
Mortgage Type
FHA
Purchase Details
Closed on
Oct 28, 1994
Sold by
Richardson Paul W
Bought by
Kinney Marilyn J
Home Financials for this Owner
Home Financials are based on the most recent Mortgage that was taken out on this home.
Original Mortgage
$76,343
Interest Rate
8.68%
Mortgage Type
FHA
Create a Home Valuation Report for This Property
The Home Valuation Report is an in-depth analysis detailing your home's value as well as a comparison with similar homes in the area
Home Values in the Area
Average Home Value in this Area
Purchase History
| Date | Buyer | Sale Price | Title Company |
|---|---|---|---|
| Webb Darrin A | $102,500 | -- | |
| Thomas Judy | $93,900 | -- | |
| Kinney Marilyn J | $77,000 | -- |
Source: Public Records
Mortgage History
| Date | Status | Borrower | Loan Amount |
|---|---|---|---|
| Open | Webb Darrin A | $82,000 | |
| Previous Owner | Thomas Judy | $93,800 | |
| Previous Owner | Kinney Marilyn J | $76,343 | |
| Closed | Webb Darrin A | $20,500 |
Source: Public Records
Tax History
| Year | Tax Paid | Tax Assessment Tax Assessment Total Assessment is a certain percentage of the fair market value that is determined by local assessors to be the total taxable value of land and additions on the property. | Land | Improvement |
|---|---|---|---|---|
| 2025 | $2,390 | $47,430 | $8,130 | $39,300 |
| 2024 | $2,390 | $47,430 | $8,130 | $39,300 |
| 2023 | $2,371 | $47,430 | $8,130 | $39,300 |
| 2022 | $2,299 | $41,650 | $8,130 | $33,520 |
| 2021 | $2,328 | $41,650 | $8,130 | $33,520 |
| 2020 | $2,416 | $41,650 | $8,130 | $33,520 |
| 2019 | $2,416 | $42,360 | $7,650 | $34,710 |
| 2018 | $2,425 | $42,360 | $7,650 | $34,710 |
| 2017 | $2,361 | $42,360 | $7,650 | $34,710 |
| 2016 | $2,229 | $38,220 | $7,180 | $31,040 |
| 2015 | $1,229 | $38,220 | $7,180 | $31,040 |
| 2014 | $3,236 | $38,220 | $7,180 | $31,040 |
Source: Public Records
Map
Nearby Homes
- 1287 Brush Row Rd
- 1030 Stevenson Rd
- 1841 Marbella Ct
- 1831 Marbella Ct
- 1823 Marbella Ct
- 1844 Marbella Ct
- 1856 Marbella Ct
- 1065 Clover Ct
- 1745 Highlander Dr
- 1764 Highlander Dr
- 1030 Independence Dr
- 1053 Ashbrooke Ln
- 2027 Liberty Ct
- 1020 Brooke Ln
- 1818 Highlander Dr
- 1138 Neeld Dr
- 955 Oak Dale Dr
- 1044 Whitestone Rd
- 1809 Palmer Ct
- 1026 Trianon Dr
- 1164 Brush Row Rd
- 1188 Brush Row Rd
- 1165 Brush Row Rd
- 1169 Brush Row Rd
- 1394 Garcia Dr
- 1388 Garcia Dr
- 1377 Garcia Dr
- 1173 Brush Row Rd
- 1152 Brush Row Rd
- 1382 Garcia Dr
- 1165 Brush Row Rd
- 1152 Brush Row Rd
- 1198 Brush Row Rd
- 1150 Simpson Dr
- 1160 Simpson Dr
- 1376 Garcia Dr
- 1164 Simpson Dr
- 1192 Brush Row Rd
- 1370 Garcia Dr
- 1140 Brush Row Rd
Your Personal Tour Guide
Ask me questions while you tour the home.