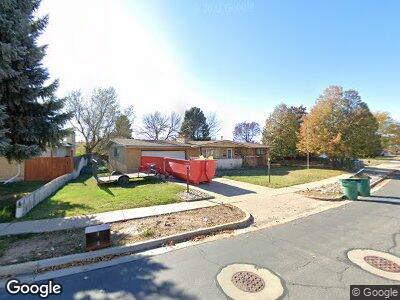
1178 E 1150 S Clearfield, UT 84015
Estimated Value: $434,000 - $466,000
4
Beds
2
Baths
2,350
Sq Ft
$193/Sq Ft
Est. Value
About This Home
This home is located at 1178 E 1150 S, Clearfield, UT 84015 and is currently estimated at $453,412, approximately $192 per square foot. 1178 E 1150 S is a home located in Davis County with nearby schools including South Clearfield Elementary School, North Davis Junior High School, and Clearfield High School.
Ownership History
Date
Name
Owned For
Owner Type
Purchase Details
Closed on
Mar 11, 2024
Sold by
Marriott Investments Llc
Bought by
Ramirez Dennis E
Current Estimated Value
Home Financials for this Owner
Home Financials are based on the most recent Mortgage that was taken out on this home.
Original Mortgage
$26,452
Outstanding Balance
$26,142
Interest Rate
6.69%
Estimated Equity
$427,270
Purchase Details
Closed on
Oct 30, 2023
Sold by
Lavonna Jean Phillips Living Trust
Bought by
Marriott Investments Llc
Home Financials for this Owner
Home Financials are based on the most recent Mortgage that was taken out on this home.
Original Mortgage
$165,000
Interest Rate
7.18%
Mortgage Type
Seller Take Back
Purchase Details
Closed on
Jul 9, 2020
Sold by
Phillips Lavonna J
Bought by
Clark Patricia Ann and Lavonna Jean Phillips Living T
Purchase Details
Closed on
Aug 15, 2012
Sold by
Phillips Lavonna J
Bought by
Phillips Lavonna J and Clark Patricia Ann
Create a Home Valuation Report for This Property
The Home Valuation Report is an in-depth analysis detailing your home's value as well as a comparison with similar homes in the area
Home Values in the Area
Average Home Value in this Area
Purchase History
| Date | Buyer | Sale Price | Title Company |
|---|---|---|---|
| Ramirez Dennis E | -- | Richland Title | |
| Marriott Investments Llc | -- | Us Title | |
| Clark Patricia Ann | -- | None Available | |
| Phillips Lavonna J | -- | Accommodation |
Source: Public Records
Mortgage History
| Date | Status | Borrower | Loan Amount |
|---|---|---|---|
| Open | Ramirez Dennis E | $26,452 | |
| Open | Ramirez Dennis E | $440,867 | |
| Previous Owner | Marriott Investments Llc | $165,000 | |
| Previous Owner | Marriott Investments Llc | $167,000 |
Source: Public Records
Tax History Compared to Growth
Tax History
| Year | Tax Paid | Tax Assessment Tax Assessment Total Assessment is a certain percentage of the fair market value that is determined by local assessors to be the total taxable value of land and additions on the property. | Land | Improvement |
|---|---|---|---|---|
| 2024 | $2,596 | $234,300 | $78,501 | $155,799 |
| 2023 | $2,076 | $344,000 | $124,581 | $219,419 |
| 2022 | $2,167 | $194,150 | $70,463 | $123,687 |
| 2021 | $1,965 | $266,000 | $80,178 | $185,822 |
| 2020 | $1,725 | $232,000 | $68,467 | $163,533 |
| 2019 | $1,680 | $223,000 | $67,993 | $155,007 |
| 2018 | $1,539 | $199,000 | $57,333 | $141,667 |
| 2016 | $1,359 | $91,850 | $24,465 | $67,385 |
| 2015 | $1,341 | $86,460 | $24,465 | $61,995 |
| 2014 | $1,283 | $83,788 | $24,465 | $59,323 |
| 2013 | -- | $81,950 | $32,571 | $49,379 |
Source: Public Records
Map
Nearby Homes
- 1596 N Main St Unit 2
- 1660 E 900 S Unit 19
- 1660 E 900 S Unit 29
- 673 E 1000 S
- 850 S 1650 E Unit D
- 2054 W Mark St
- 2013 W Mark St
- 754 S 1650 E Unit C15
- 720 S 1650 E Unit B
- 175 Ross Dr
- 635 E 700 S
- 875 S Depot St Unit C 211
- 875 S Depot St Unit C
- 875 S Depot St Unit C307
- 875 S Depot St Unit 344B
- 875 S Depot St Unit C316
- 875 S Depot St Unit 308
- 875 S Depot St Unit C212
- 1155 W 2450 N
- 15 Airlane Dr