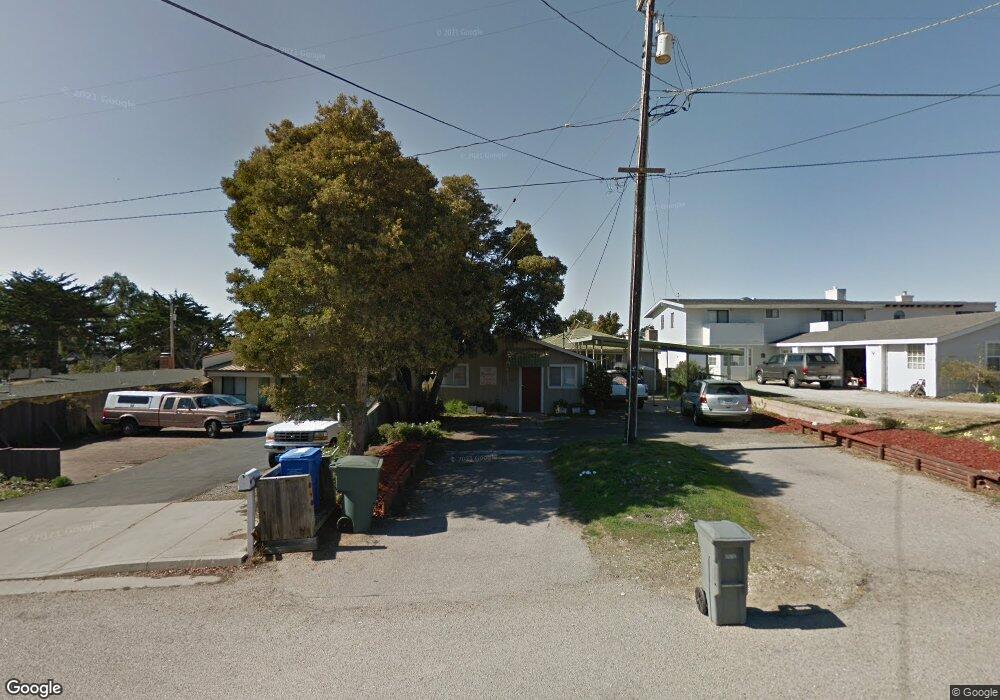
1179 4th St Unit A Los Osos, CA 93402
Estimated Value: $659,733 - $949,000
3
Beds
3
Baths
2,200
Sq Ft
$374/Sq Ft
Est. Value
About This Home
This home is located at 1179 4th St Unit A, Los Osos, CA 93402 and is currently estimated at $822,183, approximately $373 per square foot. 1179 4th St Unit A is a home located in San Luis Obispo County with nearby schools including Baywood Elementary School, Los Osos Middle School, and Morro Bay High School.
Ownership History
Date
Name
Owned For
Owner Type
Purchase Details
Closed on
Jan 18, 2017
Sold by
Moore Roberta V and Roberta V Moore Living Trust
Bought by
Bixler Austin and Bixler Ashtane
Current Estimated Value
Home Financials for this Owner
Home Financials are based on the most recent Mortgage that was taken out on this home.
Original Mortgage
$320,000
Outstanding Balance
$263,145
Interest Rate
4.3%
Mortgage Type
Commercial
Estimated Equity
$559,038
Purchase Details
Closed on
Jun 27, 2016
Sold by
Moore Roberta V
Bought by
Moore Roberta V and Roberta V Moore Living Trust
Purchase Details
Closed on
Feb 25, 2010
Sold by
Colgrove Helen A and Helen A Colgrove Trust 1996
Bought by
Colgrove Helen A
Purchase Details
Closed on
May 22, 1996
Sold by
Colgrove Helen A
Bought by
Colgrove Helen A
Create a Home Valuation Report for This Property
The Home Valuation Report is an in-depth analysis detailing your home's value as well as a comparison with similar homes in the area
Home Values in the Area
Average Home Value in this Area
Purchase History
| Date | Buyer | Sale Price | Title Company |
|---|---|---|---|
| Bixler Austin | $400,000 | Placer Title Company | |
| Moore Roberta V | -- | None Available | |
| Moore Roberta V | -- | None Available | |
| Colgrove Helen A | -- | None Available | |
| Colgrove Helen A | -- | -- |
Source: Public Records
Mortgage History
| Date | Status | Borrower | Loan Amount |
|---|---|---|---|
| Open | Bixler Austin | $320,000 |
Source: Public Records
Tax History
| Year | Tax Paid | Tax Assessment Tax Assessment Total Assessment is a certain percentage of the fair market value that is determined by local assessors to be the total taxable value of land and additions on the property. | Land | Improvement |
|---|---|---|---|---|
| 2025 | $9,712 | $527,904 | $319,160 | $208,744 |
| 2024 | $9,485 | $517,553 | $312,902 | $204,651 |
| 2023 | $9,485 | $507,406 | $306,767 | $200,639 |
| 2022 | $9,061 | $497,457 | $300,752 | $196,705 |
| 2021 | $8,148 | $428,880 | $294,855 | $134,025 |
| 2020 | $7,801 | $424,483 | $291,832 | $132,651 |
| 2019 | $7,567 | $416,160 | $286,110 | $130,050 |
| 2018 | $7,426 | $408,000 | $280,500 | $127,500 |
| 2017 | $4,199 | $63,336 | $10,541 | $52,795 |
| 2016 | $1,866 | $62,095 | $10,335 | $51,760 |
| 2015 | $1,853 | $61,163 | $10,180 | $50,983 |
| 2014 | $1,794 | $59,966 | $9,981 | $49,985 |
Source: Public Records
Map
Nearby Homes
- 1247 3rd St
- 1107 Pasadena Dr
- 0 Pasadena Dr Unit SC26007383
- 0 Pasadena Dr Unit 226009679
- 0 Pasadena Dr Unit 18798331
- 768 El Morro Ave
- 914 El Morro Ave
- 1420 5th St
- 1412 5th St
- 1168 10th St
- 1540 7th St
- 1527 11th St
- 1421 13th St
- 1705 5th St
- 1565 11th St
- 1701 8th St
- 1455 13th St
- 1231 10th St
- 1266 10th St
- 1578 13th St
Your Personal Tour Guide
Ask me questions while you tour the home.