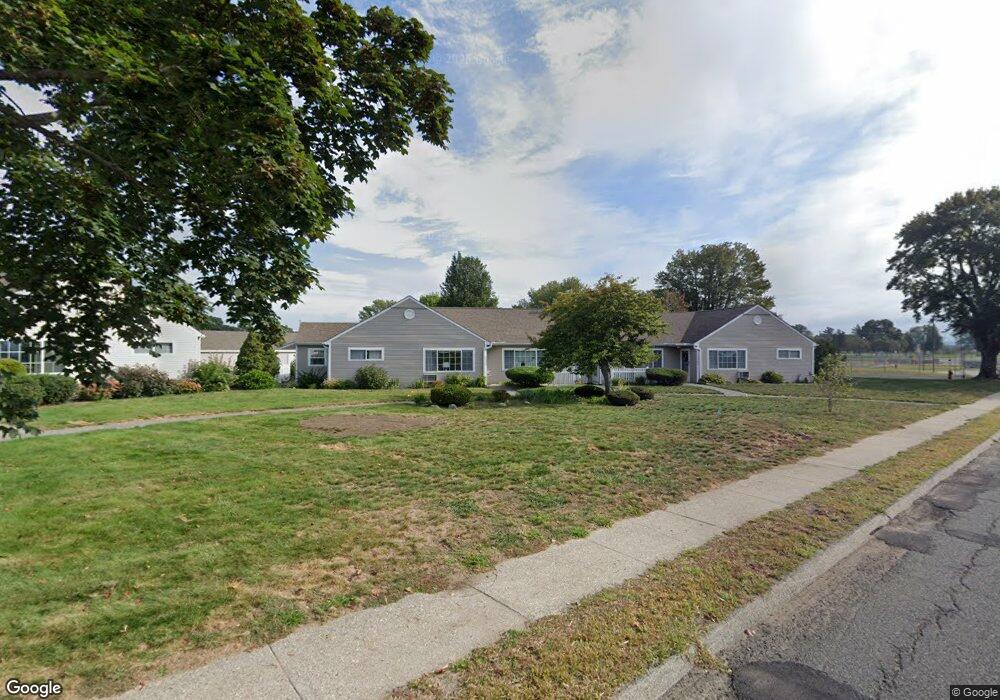
1179 James St Chicopee, MA 01022
Fairview NeighborhoodEstimated Value: $186,000 - $225,000
1
Bed
1
Bath
680
Sq Ft
$294/Sq Ft
Est. Value
About This Home
This home is located at 1179 James St, Chicopee, MA 01022 and is currently estimated at $199,689, approximately $293 per square foot. 1179 James St is a home located in Hampden County with nearby schools including Bowie Elementary School, Fairview Middle School, and Chicopee Comprehensive High School.
Ownership History
Date
Name
Owned For
Owner Type
Purchase Details
Closed on
Feb 6, 2026
Sold by
Alvarado German and Alvarado Joanne M
Bought by
Alvarado German and Alvarado Laura
Current Estimated Value
Purchase Details
Closed on
Nov 20, 2015
Sold by
Alvarado German
Bought by
Alvarado German and Alvarado Joanne M
Purchase Details
Closed on
Dec 31, 2009
Sold by
Connelly Rosalie M and Bombardier Clarisse I
Bought by
Alvarado German
Home Financials for this Owner
Home Financials are based on the most recent Mortgage that was taken out on this home.
Original Mortgage
$102,405
Interest Rate
4.85%
Mortgage Type
Purchase Money Mortgage
Purchase Details
Closed on
Nov 17, 2004
Sold by
Fournier Fleurette
Bought by
Griffin Ambrose E and Griffin Shirley L
Home Financials for this Owner
Home Financials are based on the most recent Mortgage that was taken out on this home.
Original Mortgage
$81,000
Interest Rate
5.8%
Mortgage Type
Purchase Money Mortgage
Purchase Details
Closed on
Jan 22, 1999
Sold by
Westview Dev Assocs Lp
Bought by
Fournier Fleurette
Home Financials for this Owner
Home Financials are based on the most recent Mortgage that was taken out on this home.
Original Mortgage
$40,000
Interest Rate
6.7%
Mortgage Type
Purchase Money Mortgage
Create a Home Valuation Report for This Property
The Home Valuation Report is an in-depth analysis detailing your home's value as well as a comparison with similar homes in the area
Home Values in the Area
Average Home Value in this Area
Purchase History
| Date | Buyer | Sale Price | Title Company |
|---|---|---|---|
| Alvarado German | -- | -- | |
| Alvarado German | -- | -- | |
| Alvarado German | $104,000 | -- | |
| Griffin Ambrose E | $90,000 | -- | |
| Fournier Fleurette | $65,790 | -- |
Source: Public Records
Mortgage History
| Date | Status | Borrower | Loan Amount |
|---|---|---|---|
| Previous Owner | Alvarado German | $102,405 | |
| Previous Owner | Fournier Fleurette | $5,000 | |
| Previous Owner | Griffin Ambrose E | $81,000 | |
| Previous Owner | Fournier Fleurette | $40,000 |
Source: Public Records
Tax History
| Year | Tax Paid | Tax Assessment Tax Assessment Total Assessment is a certain percentage of the fair market value that is determined by local assessors to be the total taxable value of land and additions on the property. | Land | Improvement |
|---|---|---|---|---|
| 2025 | $2,347 | $154,800 | $0 | $154,800 |
| 2024 | $2,193 | $148,600 | $0 | $148,600 |
| 2023 | $2,065 | $136,300 | $0 | $136,300 |
| 2022 | $1,947 | $114,600 | $0 | $114,600 |
| 2021 | $1,740 | $98,800 | $0 | $98,800 |
| 2020 | $1,765 | $101,100 | $0 | $101,100 |
| 2019 | $1,740 | $96,900 | $0 | $96,900 |
| 2018 | $1,697 | $92,700 | $0 | $92,700 |
| 2017 | $1,570 | $90,700 | $0 | $90,700 |
| 2016 | $1,547 | $91,500 | $0 | $91,500 |
| 2015 | $1,605 | $91,500 | $0 | $91,500 |
| 2014 | $802 | $94,400 | $0 | $94,400 |
Source: Public Records
Map
Nearby Homes
- 76 Kelley Rd
- 117 Andersen Rd
- 1181 James St
- 20 Richmond Way
- 240 Mccarthy Ave
- 104 Johnson Rd Unit 1103
- 104 Johnson Rd Unit 707
- 90 Anson St
- 156 Horseshoe Dr
- 144 Horseshoe Dr
- 81 Mccarthy Ave
- 37 Greenwood Terrace
- 58 Robinridge Rd
- 143 Royal St
- 61 Saint Jacques Ave
- 70 Greenwood Terrace
- 1709 Memorial Dr
- 128 Ann St
- 72 Honeysuckle Dr
- 18 Devlin Dr
- 1177 James St
- 1179 James St Unit X10
- 1177 James St Unit 1177
- 114 Kelley Rd
- 118 Kelley Rd
- 1173 James St
- 1171 James St
- 1169 James St
- 1167 James St
- 1169 James St Unit 1169
- 86 Kelley Rd
- 90 Kelley Rd
- 92 Kelley Rd
- 88 Kelley Rd
- 1151 James St
- 1149 James St
- 1147 James St
- 1147 James St Unit 9999
- 39 Andersen Rd
- 37 Andersen Rd
Your Personal Tour Guide
Ask me questions while you tour the home.