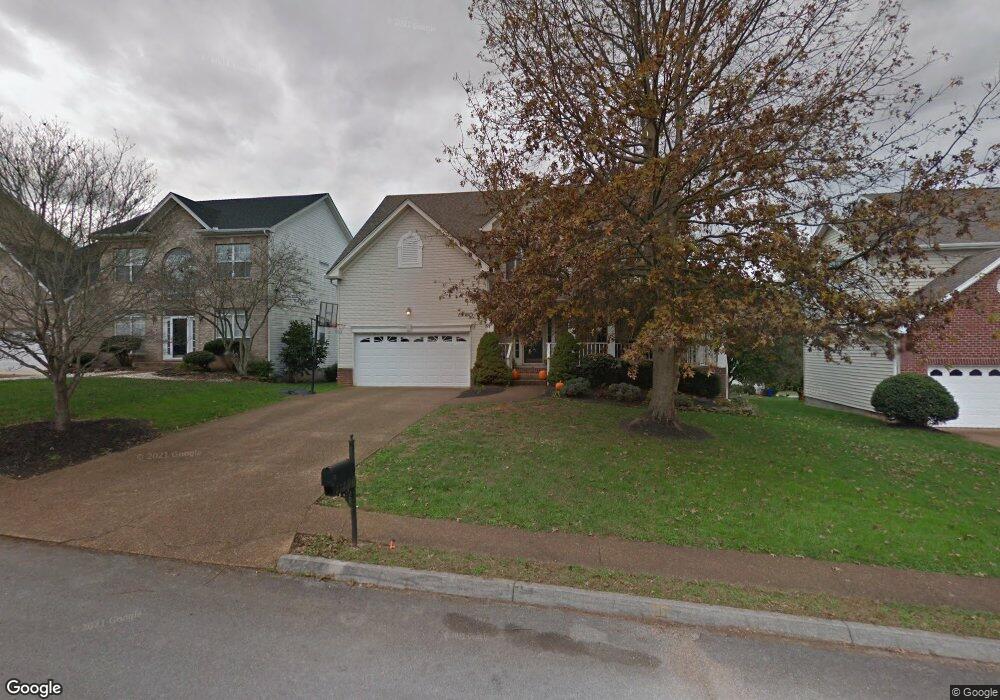
1179 Vale View Rd Unit 3 Knoxville, TN 37922
Blue Grass NeighborhoodEstimated Value: $536,000 - $604,000
3
Beds
3
Baths
2,596
Sq Ft
$221/Sq Ft
Est. Value
About This Home
This home is located at 1179 Vale View Rd Unit 3, Knoxville, TN 37922 and is currently estimated at $573,483, approximately $220 per square foot. 1179 Vale View Rd Unit 3 is a home located in Knox County with nearby schools including A.L. Lotts Elementary School, West Valley Middle School, and Bearden High School.
Ownership History
Date
Name
Owned For
Owner Type
Purchase Details
Closed on
Jan 14, 2005
Sold by
Miser Derek A
Bought by
English Jennifer
Current Estimated Value
Home Financials for this Owner
Home Financials are based on the most recent Mortgage that was taken out on this home.
Original Mortgage
$180,000
Outstanding Balance
$90,639
Interest Rate
5.71%
Mortgage Type
Purchase Money Mortgage
Estimated Equity
$482,844
Purchase Details
Closed on
Aug 7, 2003
Sold by
Miser Ashli E
Bought by
Miser Derek A
Home Financials for this Owner
Home Financials are based on the most recent Mortgage that was taken out on this home.
Original Mortgage
$202,500
Interest Rate
6.37%
Mortgage Type
Purchase Money Mortgage
Purchase Details
Closed on
Jan 29, 1998
Sold by
Beazer Homes Corp
Bought by
Miser Derek A and Miser Ashli E
Home Financials for this Owner
Home Financials are based on the most recent Mortgage that was taken out on this home.
Original Mortgage
$167,400
Interest Rate
7.07%
Mortgage Type
Purchase Money Mortgage
Create a Home Valuation Report for This Property
The Home Valuation Report is an in-depth analysis detailing your home's value as well as a comparison with similar homes in the area
Home Values in the Area
Average Home Value in this Area
Purchase History
| Date | Buyer | Sale Price | Title Company |
|---|---|---|---|
| English Jennifer | $225,000 | -- | |
| Miser Derek A | -- | -- | |
| Miser Derek A | $176,260 | -- |
Source: Public Records
Mortgage History
| Date | Status | Borrower | Loan Amount |
|---|---|---|---|
| Open | English Jennifer | $180,000 | |
| Previous Owner | Miser Derek A | $202,500 | |
| Previous Owner | Miser Derek A | $167,400 |
Source: Public Records
Tax History Compared to Growth
Tax History
| Year | Tax Paid | Tax Assessment Tax Assessment Total Assessment is a certain percentage of the fair market value that is determined by local assessors to be the total taxable value of land and additions on the property. | Land | Improvement |
|---|---|---|---|---|
| 2024 | $1,445 | $92,975 | $0 | $0 |
| 2023 | $1,445 | $92,975 | $0 | $0 |
| 2022 | $1,445 | $92,975 | $0 | $0 |
| 2021 | $1,345 | $63,425 | $0 | $0 |
| 2020 | $1,345 | $63,425 | $0 | $0 |
| 2019 | $1,345 | $63,425 | $0 | $0 |
| 2018 | $1,345 | $63,425 | $0 | $0 |
| 2017 | $1,345 | $63,425 | $0 | $0 |
| 2016 | $1,502 | $0 | $0 | $0 |
| 2015 | $1,502 | $0 | $0 | $0 |
| 2014 | $1,502 | $0 | $0 | $0 |
Source: Public Records
Map
Nearby Homes
- 1213 Vale View Rd
- 9005 Sudberry Ln
- 1219 Willowood Rd Unit 2
- 1126 Willowood Rd
- 1158 Highgrove Gardens Way
- 1105 Highgrove Garden Way
- 8926 Wesley Place
- 1027 Shadow Brook Dr
- 9156 Colchester Ridge Rd
- 901 Broken Shaft Ln
- 9230 Honors Way
- 1026 Spy Glass Way
- 9101 Highbridge Dr
- 1144 Andalusian Way
- 1415 Ebenezer Rd
- 1150 Appaloosa Way
- 8947 Linksvue Dr
- 1413 Farrington Dr Unit 1
- 8935 Linksvue Dr
- 9213 Double Eagle Ln
- 1183 Vale View Rd
- 1175 Vale View Rd
- 1191 Vale View Rd
- 1171 Vale View Rd
- 9001 Colebrook Ln Unit 412
- 9000 Roemeadow Ln
- 9006 Roemeadow Ln
- 1180 Vale View Rd Unit 3
- 1176 Vale View Rd
- 1195 Vale View Rd
- 1167 Vale View Rd
- 1172 Vale View Rd Unit 3
- 1192 Vale View Rd
- 1168 Vale View Rd
- 1199 Vale View Rd
- 1163 Vale View Rd
- 9001 Roemeadow Ln
- 9000 Colebrook Ln
- 1198 Vale View Rd
- 1164 Vale View Rd