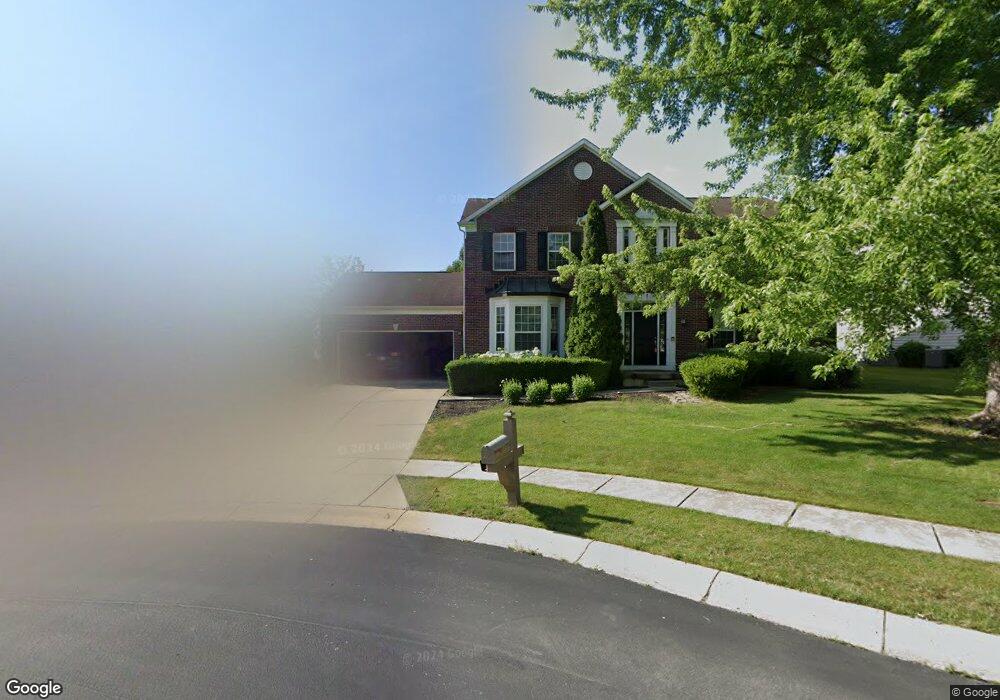
11795 Langham Crest Ct Fishers, IN 46037
Estimated Value: $415,000 - $488,000
4
Beds
3
Baths
3,832
Sq Ft
$117/Sq Ft
Est. Value
About This Home
This home is located at 11795 Langham Crest Ct, Fishers, IN 46037 and is currently estimated at $446,928, approximately $116 per square foot. 11795 Langham Crest Ct is a home located in Hamilton County with nearby schools including Fall Creek Elementary School, Fall Creek Intermediate School, and Hamilton Southeastern High School.
Ownership History
Date
Name
Owned For
Owner Type
Purchase Details
Closed on
Jan 18, 2013
Sold by
Grace Enterprises Llc
Bought by
American Homes 4 Rent Lp
Current Estimated Value
Purchase Details
Closed on
Aug 30, 2012
Sold by
Sturgell Charles C
Bought by
Grace Enterprises Llc
Purchase Details
Closed on
Jul 1, 2008
Sold by
Prudential Relocation Inc
Bought by
Sturgell Charles C and Sturgell Jennifer P
Home Financials for this Owner
Home Financials are based on the most recent Mortgage that was taken out on this home.
Original Mortgage
$241,886
Interest Rate
5.94%
Mortgage Type
FHA
Purchase Details
Closed on
Jun 26, 2008
Sold by
Glover Craig Warren and Glover Angela Marie
Bought by
Prudential Relocation Inc
Home Financials for this Owner
Home Financials are based on the most recent Mortgage that was taken out on this home.
Original Mortgage
$241,886
Interest Rate
5.94%
Mortgage Type
FHA
Create a Home Valuation Report for This Property
The Home Valuation Report is an in-depth analysis detailing your home's value as well as a comparison with similar homes in the area
Home Values in the Area
Average Home Value in this Area
Purchase History
| Date | Buyer | Sale Price | Title Company |
|---|---|---|---|
| American Homes 4 Rent Lp | -- | None Available | |
| Grace Enterprises Llc | -- | None Available | |
| Sturgell Charles C | -- | Security Title Services Llc | |
| Prudential Relocation Inc | -- | Security Title Services Llc |
Source: Public Records
Mortgage History
| Date | Status | Borrower | Loan Amount |
|---|---|---|---|
| Previous Owner | Sturgell Charles C | $241,886 |
Source: Public Records
Tax History Compared to Growth
Tax History
| Year | Tax Paid | Tax Assessment Tax Assessment Total Assessment is a certain percentage of the fair market value that is determined by local assessors to be the total taxable value of land and additions on the property. | Land | Improvement |
|---|---|---|---|---|
| 2024 | $7,140 | $337,700 | $55,500 | $282,200 |
| 2023 | $7,175 | $329,500 | $55,500 | $274,000 |
| 2022 | $6,447 | $288,700 | $55,500 | $233,200 |
| 2021 | $5,683 | $247,800 | $55,500 | $192,300 |
| 2020 | $5,396 | $233,800 | $55,500 | $178,300 |
| 2019 | $5,369 | $269,100 | $59,900 | $209,200 |
| 2018 | $5,867 | $253,100 | $59,900 | $193,200 |
| 2017 | $5,791 | $252,600 | $59,900 | $192,700 |
| 2016 | $5,561 | $244,000 | $59,900 | $184,100 |
| 2014 | $4,902 | $229,700 | $59,900 | $169,800 |
| 2013 | $4,902 | $231,700 | $59,900 | $171,800 |
Source: Public Records
Map
Nearby Homes
- 11791 Moate Dr
- 12004 Gatwick View Dr
- 14598 Meadow Bend Dr
- 11353 Geist Bay Ct
- 14402 Wolverton Way
- 12039 Jesterwood Dr
- 14058 Southwood Cir
- 12318 Whispering Breeze Dr
- 14745 Autumn View Way
- 14682 Woodstone Cir
- 11991 Shady Knoll Dr
- 11369 Easterly Blvd
- 14846 Starboard Rd
- 14332 Eddington Place
- 14910 Garden Mist Place
- 11824 Sage Creek Bend
- 13665 E 114th St
- 14982 Garden Mist Place
- Camden Plan at The Cove - Designer Collection
- Maxwell Plan at The Cove - Designer Collection
- 11795 Langham Crescent Ct
- 11799 Langham Crescent Ct
- 11760 Gatwick View Dr
- 11775 Langham Crescent Ct
- 11770 Gatwick View Dr
- 11809 Langham Crescent Ct
- 11780 Gatwick View Dr
- 11769 Langham Crescent Ct
- 11812 Langham Crescent Ct
- 11740 Gatwick View Dr
- 11816 Langham Crescent Ct
- 11814 Langham Crescent Ct
- 11811 Langham Crescent Ct
- 11755 Langham Crescent Ct
- 11790 Gatwick View Dr
- 11730 Gatwick View Dr
- 11749 Gatwick View Dr
- 11800 Gatwick View Dr
- 11825 High Cloister Ct
- 11771 Gatwick View Dr