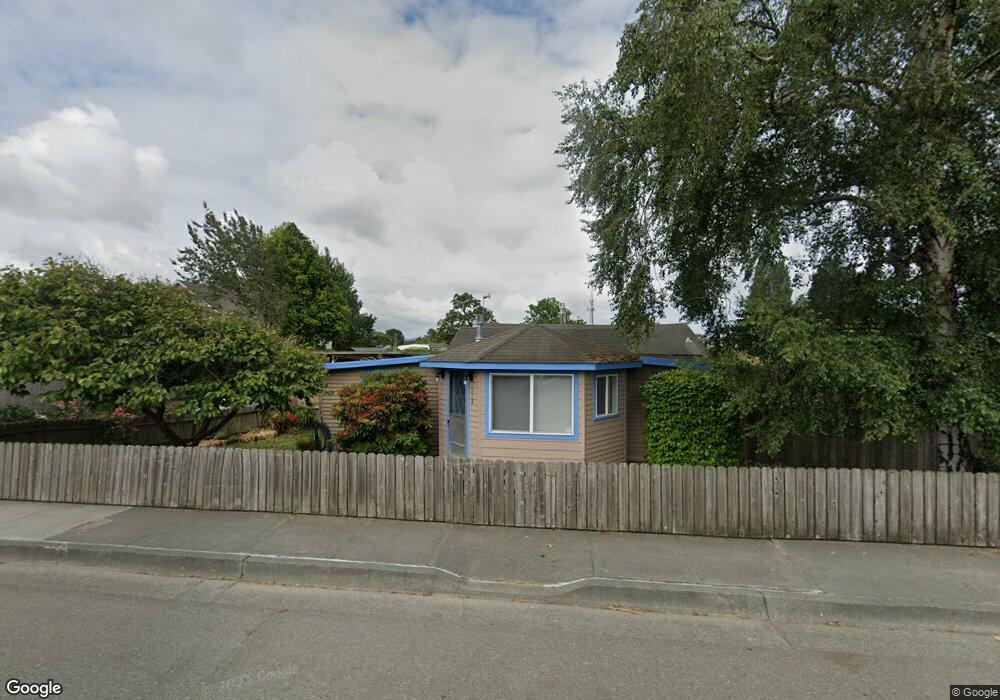
118 12th St Fortuna, CA 95540
Estimated Value: $285,000 - $380,000
2
Beds
1
Bath
1,056
Sq Ft
$324/Sq Ft
Est. Value
About This Home
This home is located at 118 12th St, Fortuna, CA 95540 and is currently estimated at $341,826, approximately $323 per square foot. 118 12th St is a home located in Humboldt County with nearby schools including Fortuna Union High School, East High School, and New Life Christian School.
Ownership History
Date
Name
Owned For
Owner Type
Purchase Details
Closed on
Sep 16, 2025
Sold by
Eugene and Eugene Kimberly Horning
Bought by
Godinho Jocelyn M and Dorris Joshua Z
Current Estimated Value
Home Financials for this Owner
Home Financials are based on the most recent Mortgage that was taken out on this home.
Original Mortgage
$280,000
Outstanding Balance
$280,000
Interest Rate
6.63%
Mortgage Type
New Conventional
Estimated Equity
$61,826
Purchase Details
Closed on
Nov 19, 2007
Sold by
Horning Eugene P and Horning Kimberly D
Bought by
Horning Eugene Philip and Horning Kimberly Dawn
Create a Home Valuation Report for This Property
The Home Valuation Report is an in-depth analysis detailing your home's value as well as a comparison with similar homes in the area
Home Values in the Area
Average Home Value in this Area
Purchase History
| Date | Buyer | Sale Price | Title Company |
|---|---|---|---|
| Godinho Jocelyn M | $350,000 | Fidelity National Title Compan | |
| Horning Eugene Philip | -- | None Available |
Source: Public Records
Mortgage History
| Date | Status | Borrower | Loan Amount |
|---|---|---|---|
| Open | Godinho Jocelyn M | $280,000 |
Source: Public Records
Tax History Compared to Growth
Tax History
| Year | Tax Paid | Tax Assessment Tax Assessment Total Assessment is a certain percentage of the fair market value that is determined by local assessors to be the total taxable value of land and additions on the property. | Land | Improvement |
|---|---|---|---|---|
| 2025 | $1,019 | $91,536 | $42,937 | $48,599 |
| 2024 | $1,019 | $89,743 | $42,096 | $47,647 |
| 2023 | $1,000 | $87,984 | $41,271 | $46,713 |
| 2022 | $998 | $86,260 | $40,462 | $45,798 |
| 2021 | $984 | $84,569 | $39,669 | $44,900 |
| 2020 | $983 | $83,703 | $39,263 | $44,440 |
| 2019 | $966 | $82,063 | $38,494 | $43,569 |
| 2018 | $954 | $80,455 | $37,740 | $42,715 |
| 2017 | $911 | $78,878 | $37,000 | $41,878 |
| 2016 | $890 | $77,332 | $36,275 | $41,057 |
| 2015 | $819 | $76,172 | $35,731 | $40,441 |
| 2014 | $798 | $74,681 | $35,032 | $39,649 |
Source: Public Records
Map
Nearby Homes