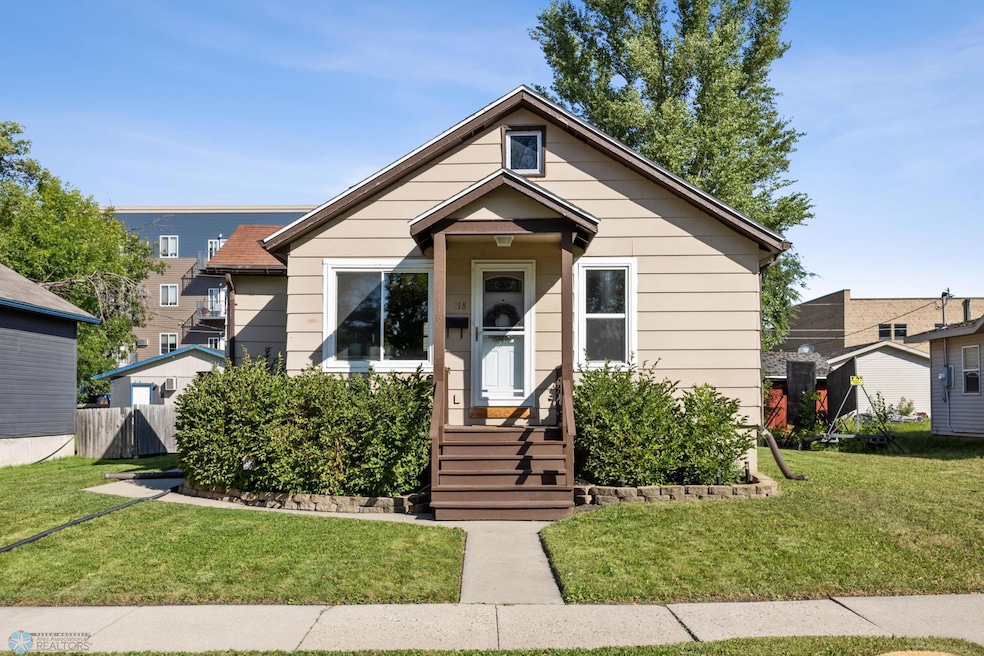
118 2nd Ave W West Fargo, ND 58078
Francis NeighborhoodEstimated payment $1,292/month
Highlights
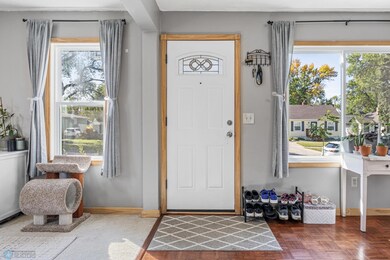
- Mud Room
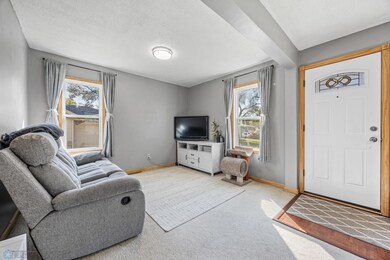
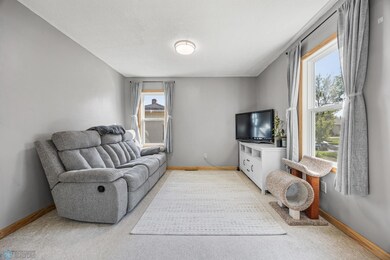
- Living Room
- Forced Air Heating and Cooling System
- No HOA
- Laundry Room
- 5-minute walk to Riverside Park
About This Home
This is such a great home for the value. Located close to downtown West Fargo makes it easy to enjoy the upcoming events. This story and half single family offers you 3 bedrooms, 2 bathrooms, and 2 stall garage with alley access and parking in both front and back of house. Garage is insulated and heated, along with an insulated attic for extra storage space. Furnace and central air have been updated along with new main floor bathroom with deep soaker tub. Some updated vinyl windows and lighting on main has been update. Extra storage or playroom available in the upstairs. Basement was repoured in 1993.
Home Details
Home Type
- Single Family
Est. Annual Taxes
- $2,003
Year Built
- Built in 1927
Lot Details
- 7,013 Sq Ft Lot
- Lot Dimensions are 50 x 140
- Partially Fenced Property
Parking
- 2 Car Garage
Interior Spaces
- 1.5-Story Property
- Mud Room
- Family Room
- Living Room
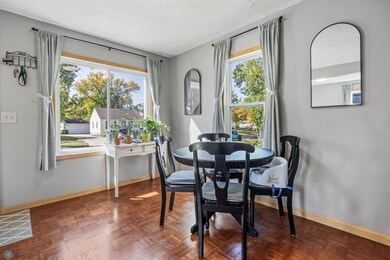
- Dining Room
- Basement
Kitchen
- Microwave
- Dishwasher
Bedrooms and Bathrooms
- 3 Bedrooms
Laundry
- Laundry Room
- Dryer
- Washer
Utilities
- Forced Air Heating and Cooling System
Community Details
- No Home Owners Association
- Sukuts Estates Subdivision
Listing and Financial Details
- Assessor Parcel Number 02210001080000
Map
Home Values in the Area
Average Home Value in this Area
Tax History
| Year | Tax Paid | Tax Assessment Tax Assessment Total Assessment is a certain percentage of the fair market value that is determined by local assessors to be the total taxable value of land and additions on the property. | Land | Improvement |
|---|---|---|---|---|
| 2024 | $1,553 | $74,600 | $14,050 | $60,550 |
| 2023 | $2,003 | $72,250 | $14,050 | $58,200 |
| 2022 | $1,933 | $66,450 | $14,050 | $52,400 |
| 2021 | $1,801 | $59,800 | $11,500 | $48,300 |
| 2020 | $1,764 | $60,200 | $11,500 | $48,700 |
| 2019 | $1,715 | $58,400 | $11,500 | $46,900 |
| 2018 | $1,501 | $52,900 | $11,500 | $41,400 |
| 2017 | $1,429 | $51,300 | $11,500 | $39,800 |
| 2016 | $1,269 | $49,650 | $11,500 | $38,150 |
| 2015 | $1,392 | $50,550 | $8,150 | $42,400 |
| 2014 | $1,368 | $47,250 | $8,150 | $39,100 |
| 2013 | $1,389 | $47,250 | $8,150 | $39,100 |
Property History
| Date | Event | Price | List to Sale | Price per Sq Ft |
|---|---|---|---|---|
| 10/14/2025 10/14/25 | Pending | -- | -- | -- |
| 09/17/2025 09/17/25 | For Sale | $213,900 | -- | $130 / Sq Ft |
Purchase History
| Date | Type | Sale Price | Title Company |
|---|---|---|---|
| Warranty Deed | $120,000 | Title Co | |
| Warranty Deed | -- | -- |
Mortgage History
| Date | Status | Loan Amount | Loan Type |
|---|---|---|---|
| Open | $114,000 | New Conventional | |
| Previous Owner | $91,177 | FHA |
Source: NorthstarMLS
MLS Number: 6790583
APN: 02-2100-01080-000
Disclaimer: Certain information contained herein is derived from information provided by parties other than Homes.com. All information provided is deemed reliable, but is not guaranteed to be accurate and should be independently verified.
![]() Based on information submitted to the MLS GRID. All data is obtained from various sources and may not have been verified by broker or MLS GRID. Supplied Open House Information is subject to change without notice. All information should be independently reviewed and verified for accuracy. Properties may or may not be listed by the office/agent presenting the information. Some IDX listings have been excluded from this website.
Based on information submitted to the MLS GRID. All data is obtained from various sources and may not have been verified by broker or MLS GRID. Supplied Open House Information is subject to change without notice. All information should be independently reviewed and verified for accuracy. Properties may or may not be listed by the office/agent presenting the information. Some IDX listings have been excluded from this website.
The Digital Millennium Copyright Act of 1998, 17 U.S.C. § 512 (the “DMCA”) provides recourse for copyright owners who believe that material appearing on the Internet infringes their rights under U.S. copyright law. If you believe in good faith that any content or material made available in connection with our website or services infringes your copyright, you (or your agent) may send us a notice requesting that the content or material be removed, or access to it blocked.
Notices must be sent in writing by email to DMCAnotice@MLSGrid.com.
The DMCA requires that your notice of alleged copyright infringement include the following information:
(1) description of the copyrighted work that is the subject of claimed infringement;
(2) description of the alleged infringing content and information sufficient to permit us to locate the content;
(3) contact information for you, including your address, telephone number and email address;
(4) a statement by you that you have a good faith belief that the content in the manner complained of is not authorized by the copyright owner, or its agent, or by the operation of any law;
(5) a statement by you, signed under penalty of perjury, that the information in the notification is accurate and that you have the authority to enforce the copyrights that are claimed to be infringed; and
(6) a physical or electronic signature of the copyright owner or a person authorized to act on the copyright owner’s behalf. Failure to include all of the above information may result in the delay of the processing of your complaint.
- 209 1st Ave E
- 320 2nd St E
- 109 5th Ave W
- 431 Morrison St
- 52 Pinewood Blvd
- 510 2nd Ave NW
- 109 7th Ave E
- 78 Evergreen Cir
- 426 3rd Ave E
- 520 6th Ave W Unit 8
- 326 7th Ave E
- 431 5th Ave E Unit 1
- 541 4th Ave NW
- 506 5th St E Unit 2
- 315 Cedar Ln
- 418 6th St E Unit 5
- 719 5th Ave W
- 1136 60th Ave W
- 645 7th Ave W
- 226 10 1/2 Ave W
