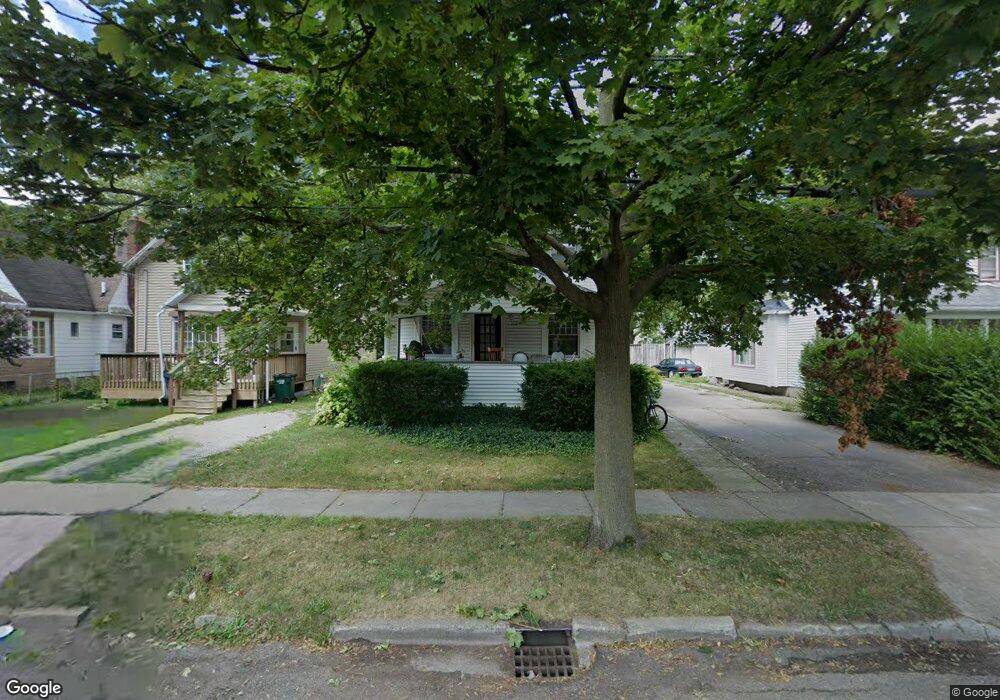
118 Allen St Lansing, MI 48912
Hunter Park NeighborhoodEstimated Value: $133,284 - $147,000
Studio
--
Bath
1,560
Sq Ft
$91/Sq Ft
Est. Value
About This Home
This home is located at 118 Allen St, Lansing, MI 48912 and is currently estimated at $141,571, approximately $90 per square foot. 118 Allen St is a home located in Ingham County with nearby schools including Pattengill Academy, Riddle Elementary School, and Eastern High School.
Ownership History
Date
Name
Owned For
Owner Type
Purchase Details
Closed on
Feb 1, 2007
Sold by
Wicksall Bethany S and Wicksall Russell M
Bought by
Wicksall Russell M
Current Estimated Value
Purchase Details
Closed on
Nov 21, 2002
Sold by
Wicksall Russell and Wicksall Bethany
Bought by
Wicksall Russell and Wicksall Bethany
Home Financials for this Owner
Home Financials are based on the most recent Mortgage that was taken out on this home.
Original Mortgage
$76,000
Interest Rate
6.23%
Purchase Details
Closed on
Aug 1, 1995
Create a Home Valuation Report for This Property
The Home Valuation Report is an in-depth analysis detailing your home's value as well as a comparison with similar homes in the area
Home Values in the Area
Average Home Value in this Area
Purchase History
| Date | Buyer | Sale Price | Title Company |
|---|---|---|---|
| Wicksall Russell M | -- | None Available | |
| Wicksall Russell | -- | -- | |
| Wicksall Russell | -- | -- | |
| -- | $50,200 | -- |
Source: Public Records
Mortgage History
| Date | Status | Borrower | Loan Amount |
|---|---|---|---|
| Previous Owner | Wicksall Russell | $76,000 |
Source: Public Records
Tax History
| Year | Tax Paid | Tax Assessment Tax Assessment Total Assessment is a certain percentage of the fair market value that is determined by local assessors to be the total taxable value of land and additions on the property. | Land | Improvement |
|---|---|---|---|---|
| 2025 | $3,215 | $72,900 | $3,500 | $69,400 |
| 2024 | $27 | $63,900 | $3,500 | $60,400 |
| 2023 | $3,025 | $54,900 | $3,500 | $51,400 |
| 2022 | $2,762 | $48,100 | $2,800 | $45,300 |
| 2021 | $2,698 | $45,600 | $4,700 | $40,900 |
| 2020 | $2,679 | $43,500 | $4,700 | $38,800 |
| 2019 | $2,589 | $38,600 | $4,700 | $33,900 |
| 2018 | $2,454 | $34,800 | $4,700 | $30,100 |
| 2017 | $2,362 | $34,800 | $4,700 | $30,100 |
| 2016 | $1,758 | $33,200 | $4,700 | $28,500 |
| 2015 | $1,758 | $30,700 | $9,345 | $21,355 |
| 2014 | $1,758 | $30,900 | $7,268 | $23,632 |
Source: Public Records
Map
Nearby Homes
- 121 Lathrop St
- 129 Clifford St
- 1713 Stanley Ct
- 1346 Eureka St
- 206 Custer Ave
- 400 Lathrop St
- 222 S Clemens Ave
- 509 Clifford St
- 523 Clifford St
- 2021 Jerome St
- 607 Shepard St Unit 2
- 217 N Magnolia Ave
- 316 Jones St
- 619 Shepard St
- 517 S Clemens Ave
- 311 N Magnolia Ave
- 1024 Eureka St
- 528 S Fairview Ave
- 404 S Hayford Ave
- 1116 Hickory St
Your Personal Tour Guide
Ask me questions while you tour the home.