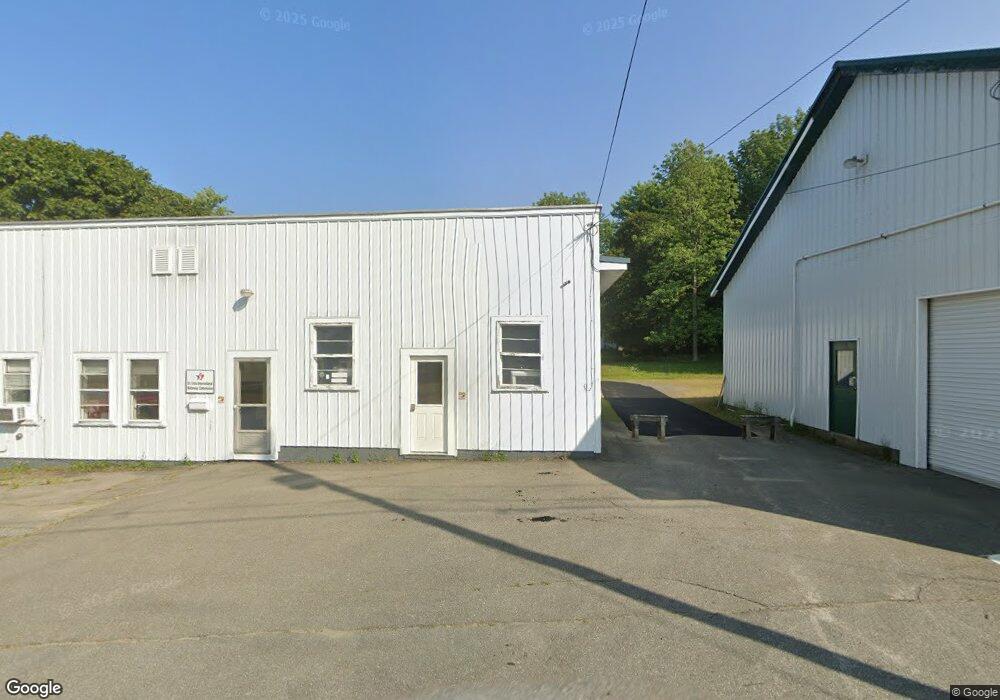
118 Barker St Calais, ME 04619
Estimated Value: $236,000 - $312,702
4
Beds
2
Baths
992
Sq Ft
$284/Sq Ft
Est. Value
About This Home
This home is located at 118 Barker St, Calais, ME 04619 and is currently estimated at $281,426, approximately $283 per square foot. 118 Barker St is a home with nearby schools including Calais Elementary School and Calais Middle/High School.
Ownership History
Date
Name
Owned For
Owner Type
Purchase Details
Closed on
Jul 8, 2025
Sold by
Delaney Dr K and Delaney Lloyd
Bought by
Delaney Kelly L
Current Estimated Value
Home Financials for this Owner
Home Financials are based on the most recent Mortgage that was taken out on this home.
Original Mortgage
$239,920
Outstanding Balance
$239,109
Interest Rate
6.89%
Mortgage Type
New Conventional
Estimated Equity
$42,317
Create a Home Valuation Report for This Property
The Home Valuation Report is an in-depth analysis detailing your home's value as well as a comparison with similar homes in the area
Home Values in the Area
Average Home Value in this Area
Purchase History
| Date | Buyer | Sale Price | Title Company |
|---|---|---|---|
| Delaney Kelly L | $299,900 | -- | |
| Delaney Kelly L | $299,900 | -- | |
| Delaney Kelly L | $299,900 | -- |
Source: Public Records
Mortgage History
| Date | Status | Borrower | Loan Amount |
|---|---|---|---|
| Open | Delaney Kelly L | $239,920 | |
| Closed | Delaney Kelly L | $239,920 |
Source: Public Records
Tax History Compared to Growth
Tax History
| Year | Tax Paid | Tax Assessment Tax Assessment Total Assessment is a certain percentage of the fair market value that is determined by local assessors to be the total taxable value of land and additions on the property. | Land | Improvement |
|---|---|---|---|---|
| 2024 | $4,133 | $275,500 | $18,300 | $257,200 |
| 2023 | $4,043 | $237,800 | $15,800 | $222,000 |
| 2022 | $3,648 | $192,000 | $12,700 | $179,300 |
| 2021 | $3,979 | $184,200 | $12,200 | $172,000 |
| 2020 | $3,982 | $157,400 | $10,400 | $147,000 |
| 2019 | $3,982 | $157,400 | $10,400 | $147,000 |
| 2018 | $3,982 | $157,400 | $10,400 | $147,000 |
| 2017 | $3,982 | $157,400 | $10,400 | $147,000 |
| 2016 | $3,982 | $157,400 | $10,400 | $147,000 |
| 2015 | $3,982 | $157,400 | $10,400 | $147,000 |
| 2014 | $3,982 | $157,400 | $10,400 | $147,000 |
| 2013 | $3,982 | $157,400 | $10,400 | $147,000 |
Source: Public Records
Map
Nearby Homes