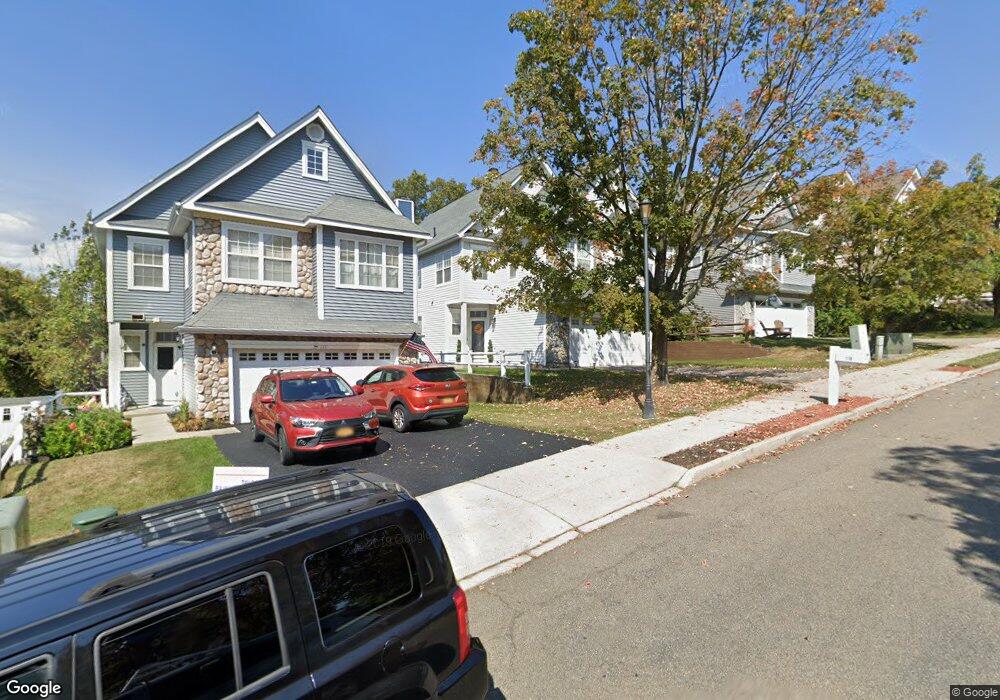
118 Benefield Blvd Unit 118 Peekskill, NY 10566
Estimated Value: $711,000 - $743,000
4
Beds
3
Baths
3,000
Sq Ft
$243/Sq Ft
Est. Value
About This Home
This home is located at 118 Benefield Blvd Unit 118, Peekskill, NY 10566 and is currently estimated at $730,121, approximately $243 per square foot. 118 Benefield Blvd Unit 118 is a home located in Westchester County with nearby schools including Hillcrest School, Oakside School, and Woodside Elementary School.
Ownership History
Date
Name
Owned For
Owner Type
Purchase Details
Closed on
Jun 27, 2025
Sold by
Collins Donvil and Collins Charlene
Bought by
Campbell Dwayne and Campbell Kimberly
Current Estimated Value
Home Financials for this Owner
Home Financials are based on the most recent Mortgage that was taken out on this home.
Original Mortgage
$643,500
Outstanding Balance
$642,419
Interest Rate
6.89%
Mortgage Type
New Conventional
Estimated Equity
$87,702
Purchase Details
Closed on
Feb 16, 2018
Sold by
Dunkley Edith and King Edith
Bought by
Collings Charlenc and Collings Donvil
Home Financials for this Owner
Home Financials are based on the most recent Mortgage that was taken out on this home.
Original Mortgage
$388,336
Interest Rate
4.62%
Mortgage Type
FHA
Purchase Details
Closed on
Jul 30, 1996
Sold by
K Hovnanian At Northern Westchester Inc
Bought by
King Jesse L and Dunkley Edith
Create a Home Valuation Report for This Property
The Home Valuation Report is an in-depth analysis detailing your home's value as well as a comparison with similar homes in the area
Home Values in the Area
Average Home Value in this Area
Purchase History
| Date | Buyer | Sale Price | Title Company |
|---|---|---|---|
| Campbell Dwayne | $725,000 | Stewart Title Insurance Compan | |
| Collings Charlenc | $395,500 | Thoroughbred Title Svcs Llc | |
| King Jesse L | $245,633 | -- |
Source: Public Records
Mortgage History
| Date | Status | Borrower | Loan Amount |
|---|---|---|---|
| Open | Campbell Dwayne | $643,500 | |
| Previous Owner | Collings Charlenc | $388,336 |
Source: Public Records
Tax History
| Year | Tax Paid | Tax Assessment Tax Assessment Total Assessment is a certain percentage of the fair market value that is determined by local assessors to be the total taxable value of land and additions on the property. | Land | Improvement |
|---|---|---|---|---|
| 2024 | $17,352 | $13,500 | $3,000 | $10,500 |
| 2023 | $16,764 | $13,500 | $3,000 | $10,500 |
| 2022 | $17,259 | $13,500 | $3,000 | $10,500 |
| 2021 | $15,861 | $13,500 | $3,000 | $10,500 |
| 2020 | $16,210 | $13,500 | $3,000 | $10,500 |
| 2019 | $15,014 | $13,500 | $3,000 | $10,500 |
| 2018 | $2,713 | $13,500 | $3,000 | $10,500 |
| 2017 | $0 | $13,500 | $3,000 | $10,500 |
| 2016 | $14,148 | $13,500 | $3,000 | $10,500 |
| 2015 | -- | $13,500 | $3,000 | $10,500 |
| 2014 | -- | $13,500 | $3,000 | $10,500 |
| 2013 | -- | $13,500 | $3,000 | $10,500 |
Source: Public Records
Map
Nearby Homes
- 103 Leda Dr
- 1824 Seabury Place
- 1716 Westchester Ave
- 104 Mallard Way
- 1716A Main St
- 1763 Park St
- 1767 Park St
- 192 Benefield Blvd
- 1840 Crompond Rd Unit 2C2
- 1840 Crompond Rd Unit 2A3
- 1840 Crompond Rd Unit 7B8
- 1840 Crompond Rd Unit 4A3
- 1840 Crompond Rd Unit 7C6
- 1840 Crompond Rd Unit 5C8
- 1840 Crompond Rd Unit 9A6
- 1840 Crompond Rd Unit 9B7
- 20 Beecher Ln
- 4 Nottingham Cir
- 23 Nottingham Cir
- 150 Overlook Ave Unit 4L
- 116 Benefield Blvd
- 120 Benefield Blvd
- 122 Benefield Blvd
- 112 Benefield Blvd
- 114 Benefield Blvd
- 124 Benefield Blvd
- 110 Benefield Blvd
- 126 Benefield Blvd
- 2 Patterson Ct
- 128 Benefield Blvd
- 108 Benefield Blvd
- 4 Patterson Ct
- 130 Benefield Blvd
- 111 Benefield Blvd
- 115 Benefield Blvd
- 104 Benefield Blvd
- 106 Benefield Blvd
- 6 Patterson Ct
- 109 Benefield Blvd
- 132 Benefield Blvd
Your Personal Tour Guide
Ask me questions while you tour the home.