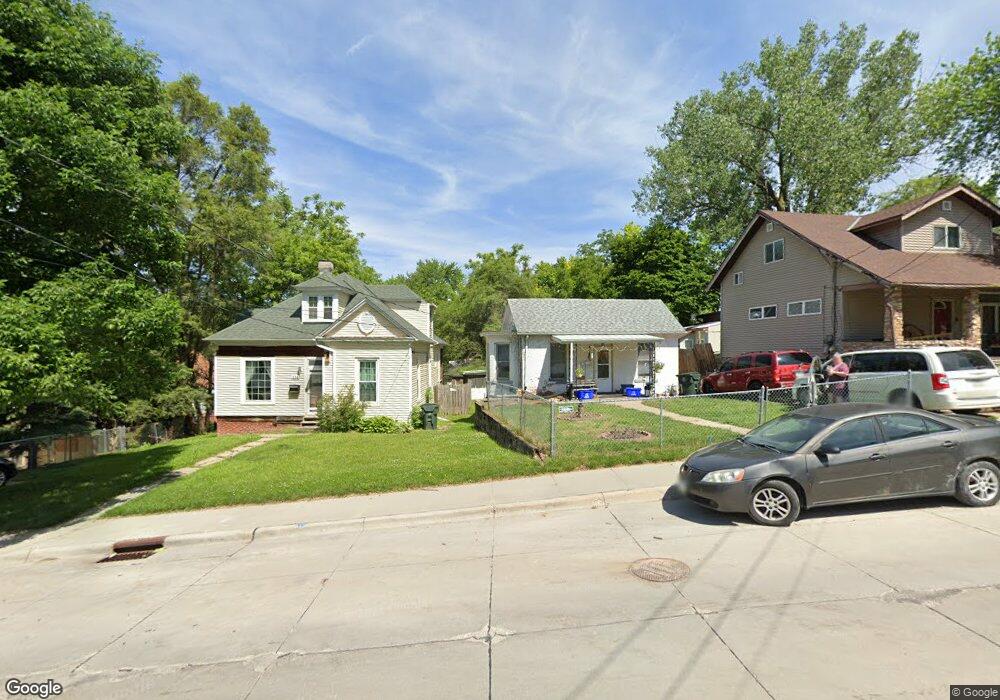
118 Bloomer St Council Bluffs, IA 51503
Downtown Council Bluffs NeighborhoodEstimated Value: $126,195 - $167,000
1
Bed
1
Bath
713
Sq Ft
$203/Sq Ft
Est. Value
About This Home
This home is located at 118 Bloomer St, Council Bluffs, IA 51503 and is currently estimated at $144,549, approximately $202 per square foot. 118 Bloomer St is a home located in Pottawattamie County with nearby schools including Bloomer Elementary School, Gerald W. Kirn Middle School, and Abraham Lincoln High School.
Ownership History
Date
Name
Owned For
Owner Type
Purchase Details
Closed on
Dec 17, 2012
Sold by
Arrick Teri D
Bought by
Council Bluffs Development Corporation L
Current Estimated Value
Home Financials for this Owner
Home Financials are based on the most recent Mortgage that was taken out on this home.
Original Mortgage
$15,370
Outstanding Balance
$10,634
Interest Rate
3.34%
Mortgage Type
Future Advance Clause Open End Mortgage
Estimated Equity
$133,915
Create a Home Valuation Report for This Property
The Home Valuation Report is an in-depth analysis detailing your home's value as well as a comparison with similar homes in the area
Home Values in the Area
Average Home Value in this Area
Purchase History
| Date | Buyer | Sale Price | Title Company |
|---|---|---|---|
| Council Bluffs Development Corporation L | $20,000 | None Available |
Source: Public Records
Mortgage History
| Date | Status | Borrower | Loan Amount |
|---|---|---|---|
| Open | Council Bluffs Development Corporation L | $15,370 |
Source: Public Records
Tax History Compared to Growth
Tax History
| Year | Tax Paid | Tax Assessment Tax Assessment Total Assessment is a certain percentage of the fair market value that is determined by local assessors to be the total taxable value of land and additions on the property. | Land | Improvement |
|---|---|---|---|---|
| 2025 | $1,644 | $89,300 | $19,300 | $70,000 |
| 2024 | $1,644 | $81,600 | $16,800 | $64,800 |
| 2023 | $1,626 | $81,600 | $16,800 | $64,800 |
| 2022 | $1,454 | $62,000 | $16,600 | $45,400 |
| 2021 | $2,146 | $62,000 | $16,600 | $45,400 |
| 2020 | $1,326 | $55,400 | $12,100 | $43,300 |
| 2019 | $1,372 | $53,402 | $12,159 | $41,243 |
| 2018 | $1,348 | $53,402 | $12,159 | $41,243 |
| 2017 | $1,362 | $53,402 | $12,159 | $41,243 |
| 2015 | $1,332 | $53,402 | $12,159 | $41,243 |
| 2014 | $1,334 | $53,402 | $12,159 | $41,243 |
Source: Public Records
Map
Nearby Homes