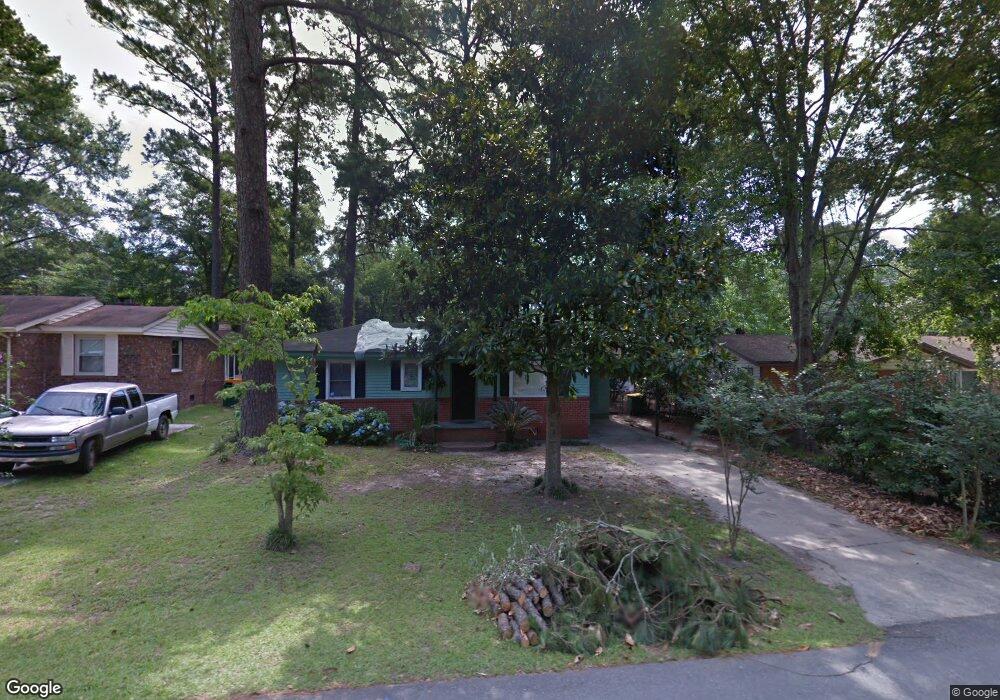
118 Bowman Ave Unit 9 Savannah, GA 31408
Estimated Value: $201,000 - $252,000
2
Beds
1
Bath
920
Sq Ft
$245/Sq Ft
Est. Value
About This Home
This home is located at 118 Bowman Ave Unit 9, Savannah, GA 31408 and is currently estimated at $225,082, approximately $244 per square foot. 118 Bowman Ave Unit 9 is a home located in Chatham County with nearby schools including Otis J. Brock, III Elementary School, Mercer Middle School, and Groves High School.
Ownership History
Date
Name
Owned For
Owner Type
Purchase Details
Closed on
Oct 11, 2022
Sold by
A & A Gc Properties Llc
Bought by
Jordan Cristy
Current Estimated Value
Home Financials for this Owner
Home Financials are based on the most recent Mortgage that was taken out on this home.
Original Mortgage
$216,015
Outstanding Balance
$207,733
Interest Rate
6.12%
Mortgage Type
FHA
Estimated Equity
$17,349
Purchase Details
Closed on
Jul 26, 2021
Sold by
Beatty Sheryl F
Bought by
Bowen Adam G
Home Financials for this Owner
Home Financials are based on the most recent Mortgage that was taken out on this home.
Original Mortgage
$107,950
Interest Rate
3%
Mortgage Type
New Conventional
Purchase Details
Closed on
Apr 25, 2018
Sold by
Beatty Charles Waring
Bought by
Beatty Sheryl F
Create a Home Valuation Report for This Property
The Home Valuation Report is an in-depth analysis detailing your home's value as well as a comparison with similar homes in the area
Home Values in the Area
Average Home Value in this Area
Purchase History
| Date | Buyer | Sale Price | Title Company |
|---|---|---|---|
| Jordan Cristy | $220,000 | -- | |
| Jordan Cristy | $220,000 | -- | |
| Bowen Adam G | $127,000 | -- | |
| Bowen Adam G | $127,000 | -- | |
| Beatty Sheryl F | -- | -- | |
| Beatty Sheryl F | -- | -- |
Source: Public Records
Mortgage History
| Date | Status | Borrower | Loan Amount |
|---|---|---|---|
| Open | Jordan Cristy | $216,015 | |
| Previous Owner | Bowen Adam G | $107,950 |
Source: Public Records
Tax History Compared to Growth
Tax History
| Year | Tax Paid | Tax Assessment Tax Assessment Total Assessment is a certain percentage of the fair market value that is determined by local assessors to be the total taxable value of land and additions on the property. | Land | Improvement |
|---|---|---|---|---|
| 2025 | $2,426 | $84,160 | $20,000 | $64,160 |
| 2024 | $2,426 | $71,720 | $16,000 | $55,720 |
| 2023 | $1,949 | $63,040 | $16,000 | $47,040 |
| 2022 | $872 | $39,360 | $5,200 | $34,160 |
| 2021 | $893 | $26,280 | $5,200 | $21,080 |
| 2020 | $718 | $24,320 | $5,200 | $19,120 |
| 2019 | $718 | $21,040 | $5,200 | $15,840 |
| 2018 | $679 | $20,840 | $5,200 | $15,640 |
| 2017 | $682 | $21,080 | $5,200 | $15,880 |
| 2016 | $682 | $21,280 | $5,200 | $16,080 |
| 2015 | $1,008 | $20,680 | $3,960 | $16,720 |
| 2014 | $986 | $21,640 | $0 | $0 |
Source: Public Records
Map
Nearby Homes
- 117 Bowman Ave
- 97 Azalea Ave
- 34 Smith Ave
- 123 Camellia Ave
- 13 Ronnie Ave
- 171 Smith Ave
- 169 Varnedoe Ave
- 64 Lee Ave
- 5021 Augusta Rd
- 17 Russell Ave
- 0 Water Oak Way Unit SA339388
- 202 Byck Ave
- 230 Byck Ave
- 4120 6th St
- 4009 4th St
- 410 Turnberry St
- 3503 Haslam Ave
- 4116 Old Louisville Rd
- 0 Old Louisville Rd Unit SA333709
- 214 Cantyre St